The Flow Process
Rutgers senior capstone exhibition process
“The Flow” Was a massive undertaking for me and was actually three projects combined into one capstone. Here I will show you some of the behind the scenes of my work for this project.
The Process
The Shoe Concepts
Rutgers University
Year
2025
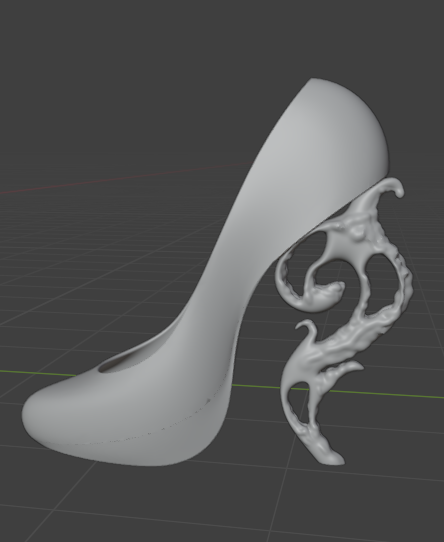
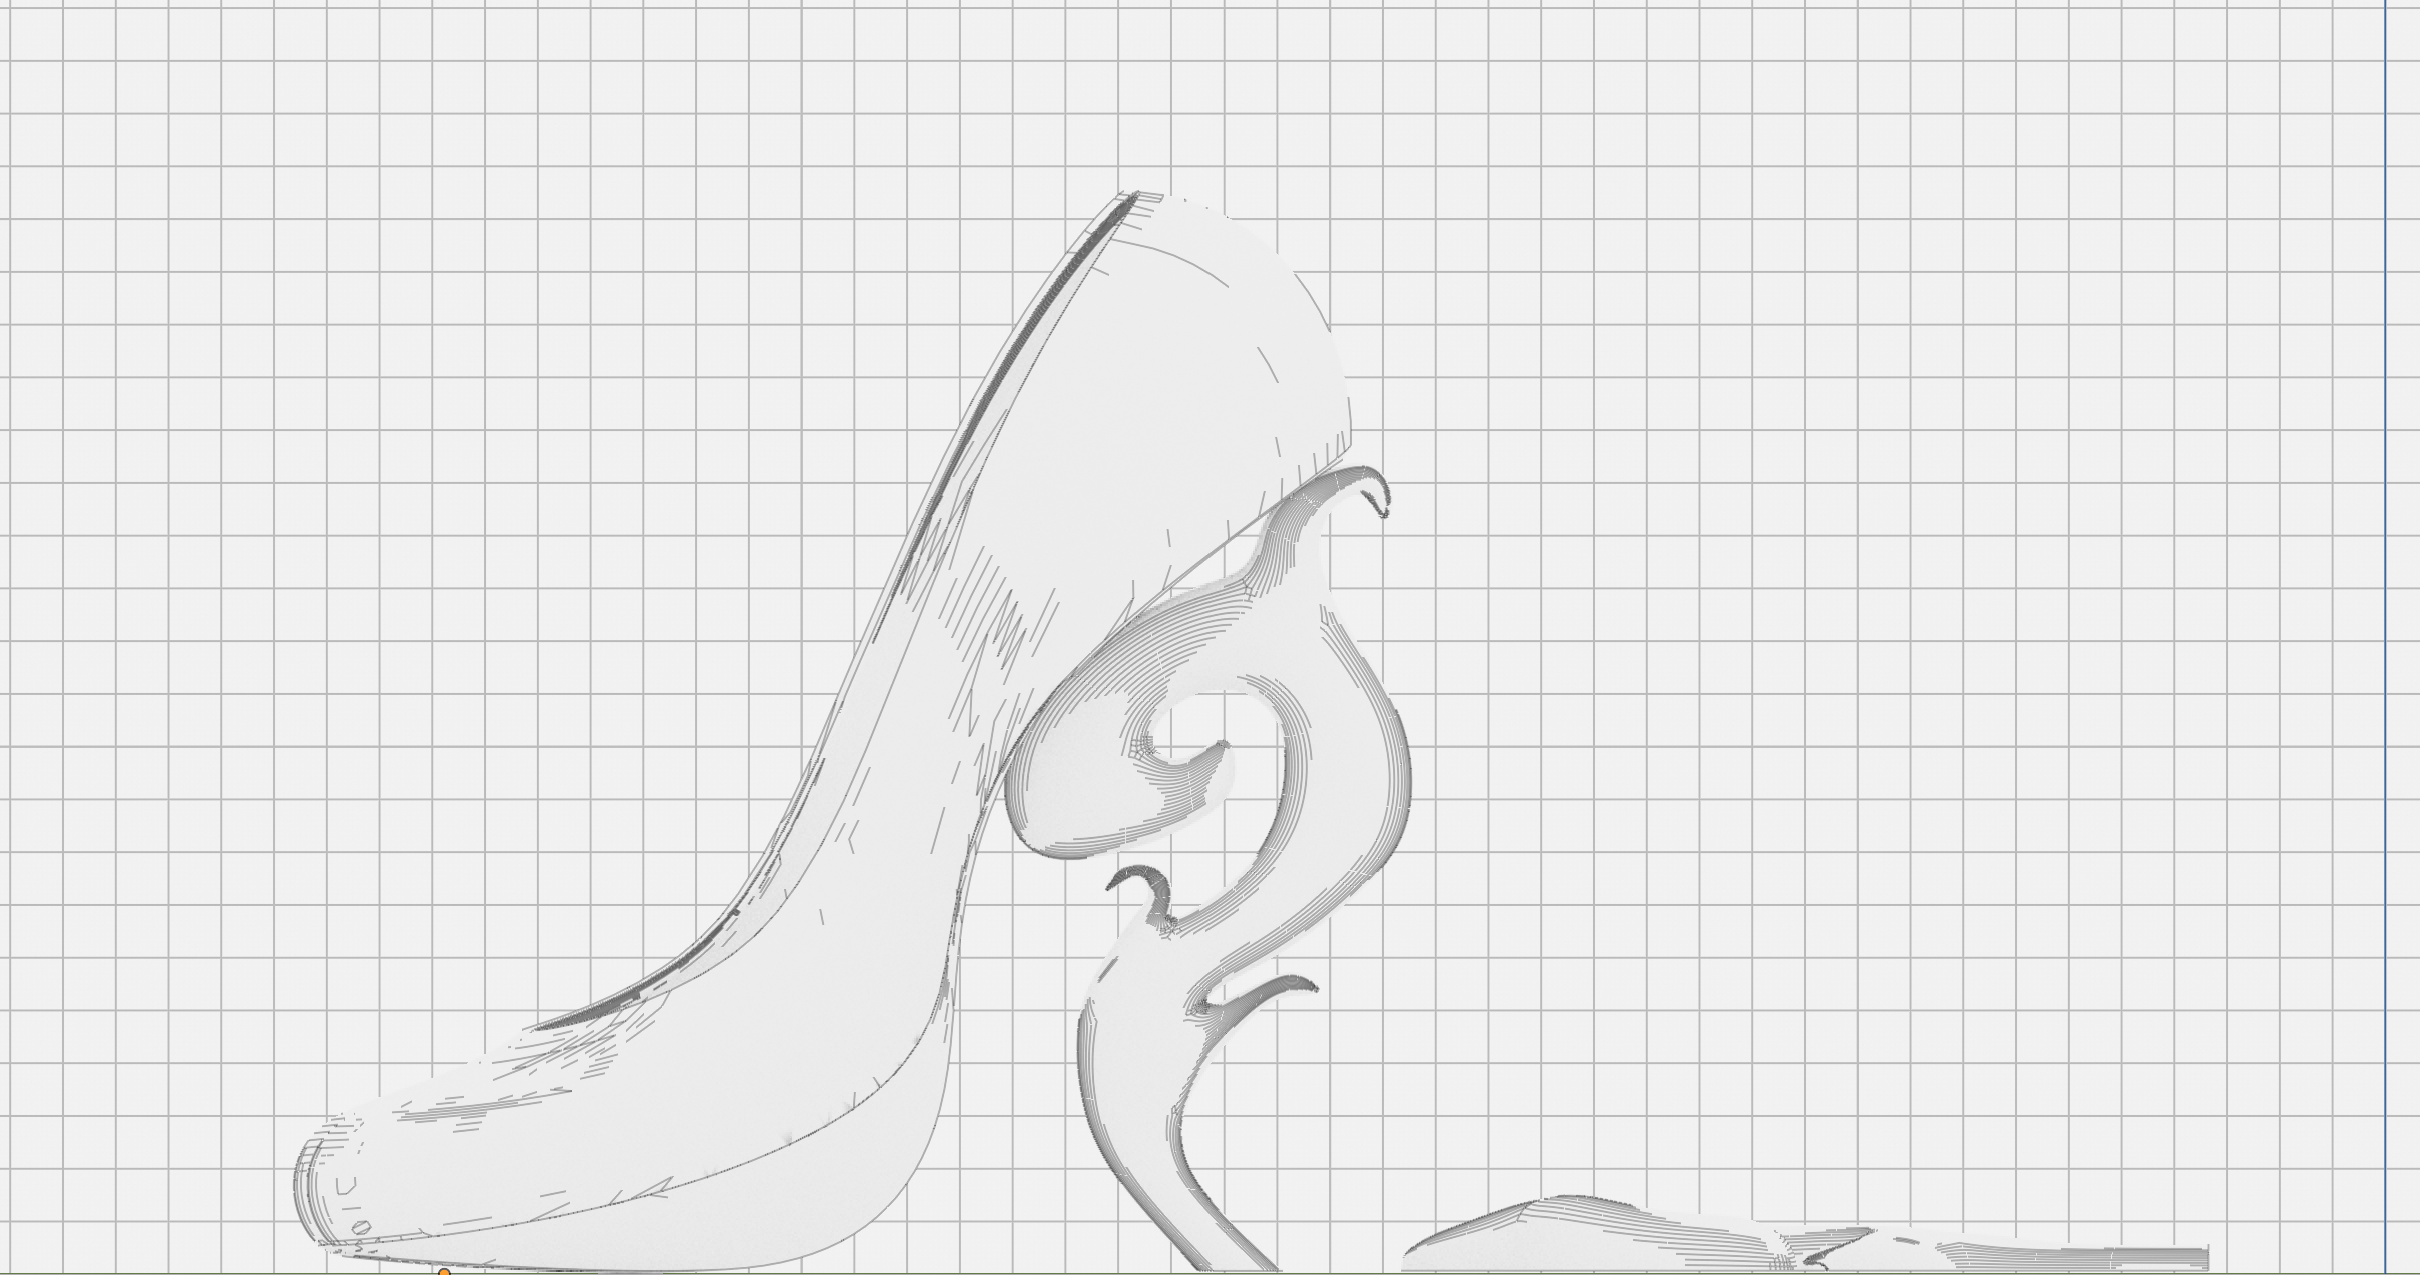
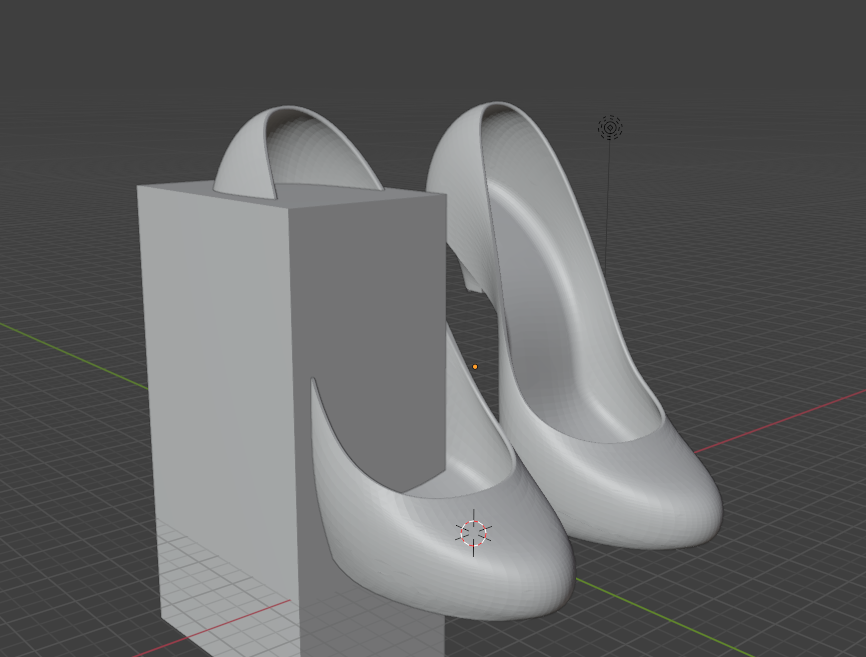
As is the case with every project I have ever worked on I started out with some rough sketches on what I might want the shoe to look like. As this was my very first real attempt at modeling from scratch I knew this would be a challenge for me.
The Shoe Beginning stages of geometric exploration
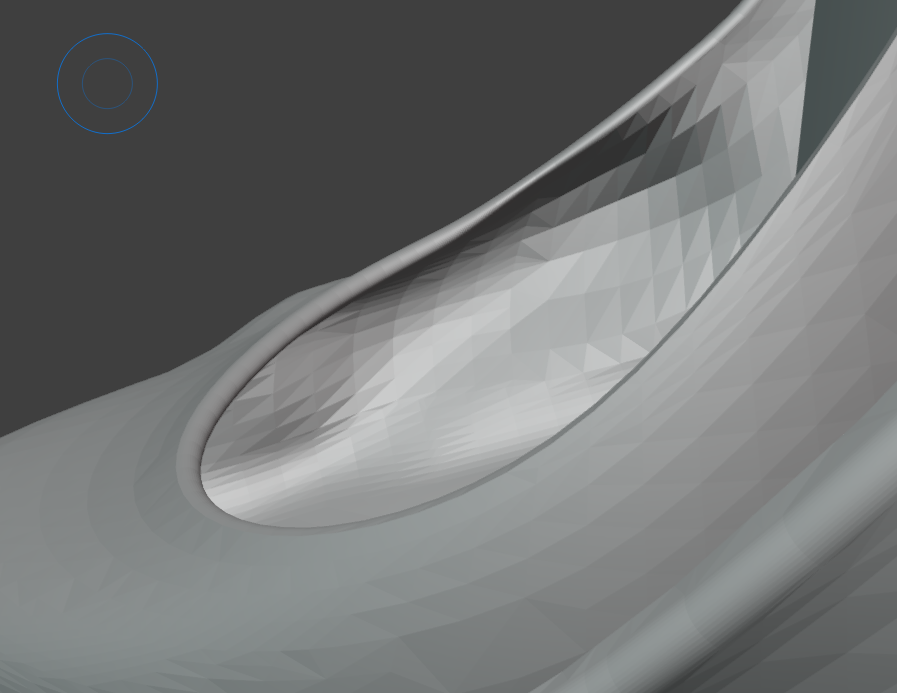
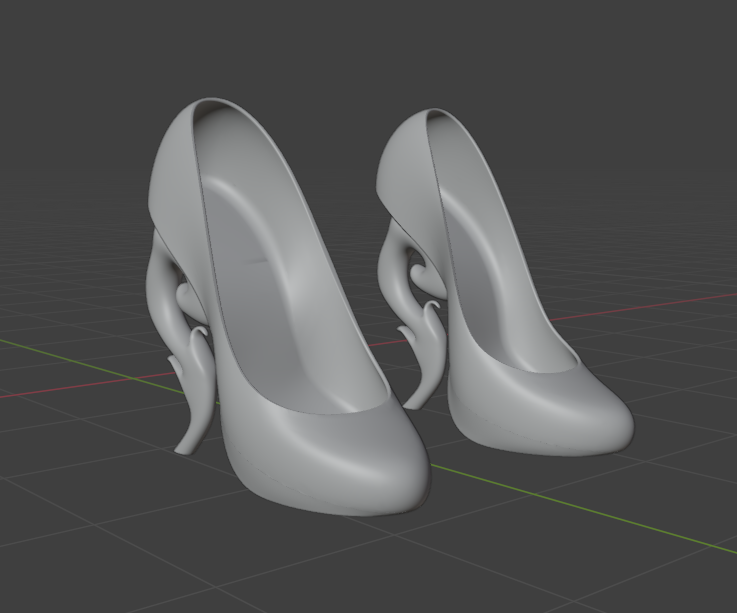
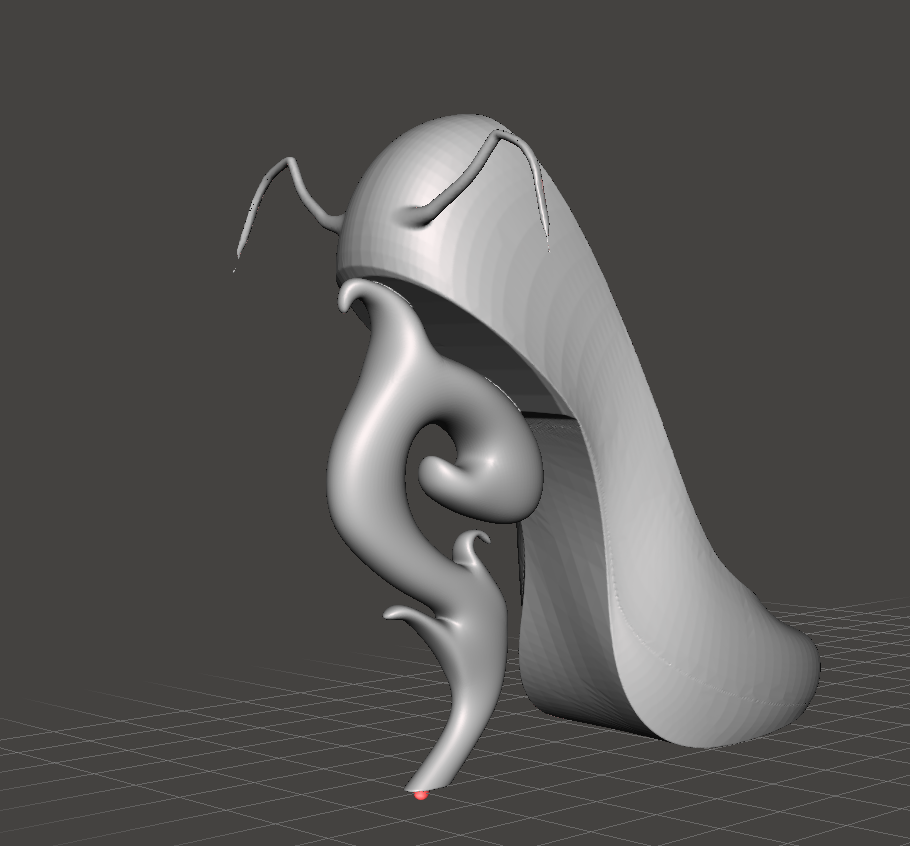
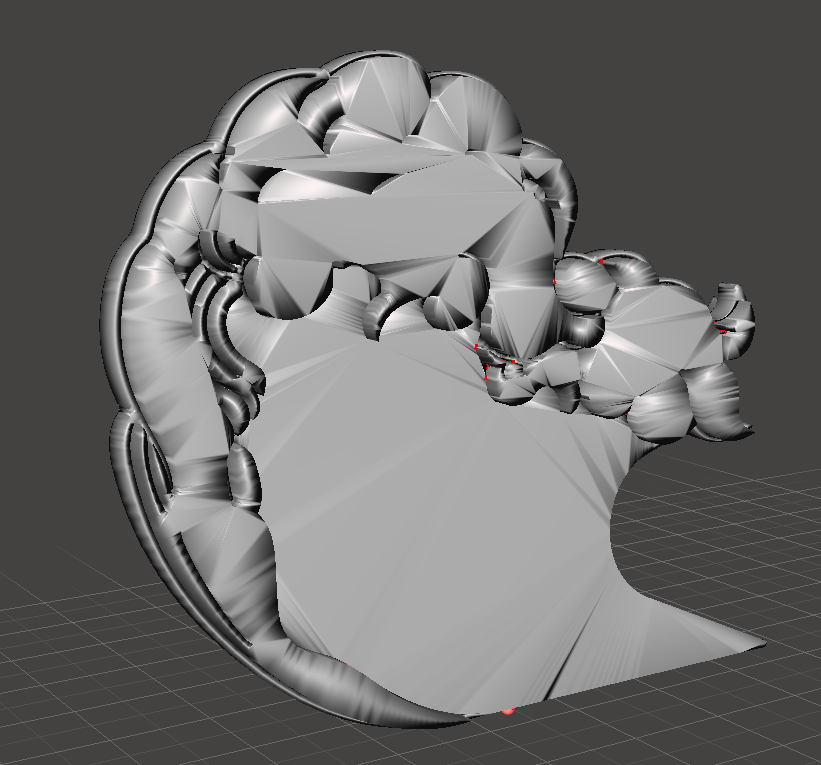
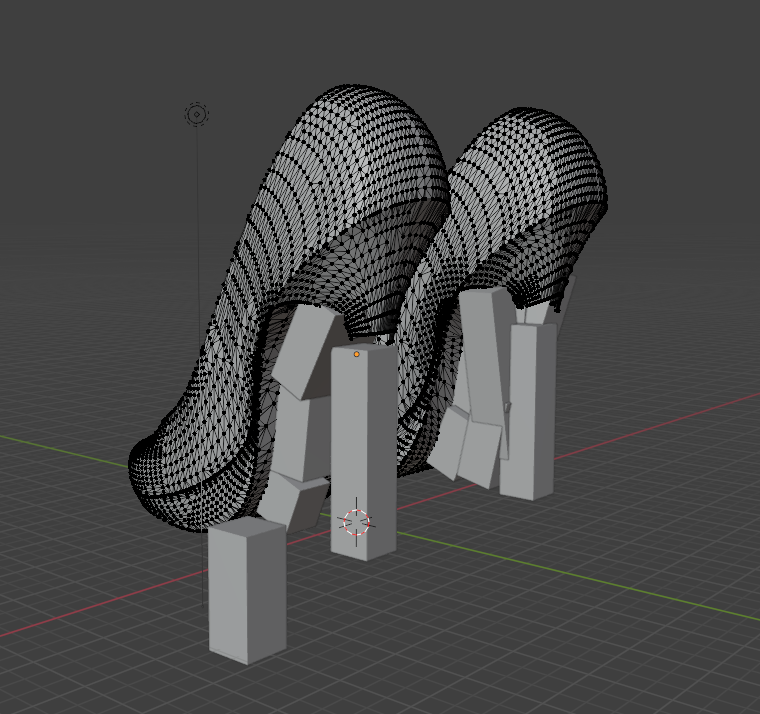
I began the process for creating these pieces by sculpting in the 3D modeling program known as blender. As I had little knowledge of the program after I found a good pair of shapes that could serve as the sole of the shoe I would begin my process of learning to sculpt the heels themselves starting with geometric exploration.
The Shoe Hammering out the kinks
After working with this project for over a week now, and seemingly getting no where, I would suddenly have a breakthrough with my exploration of the sculpting tools and would create a number of shapes similar to my initial sketches.
The Shoe Next steps
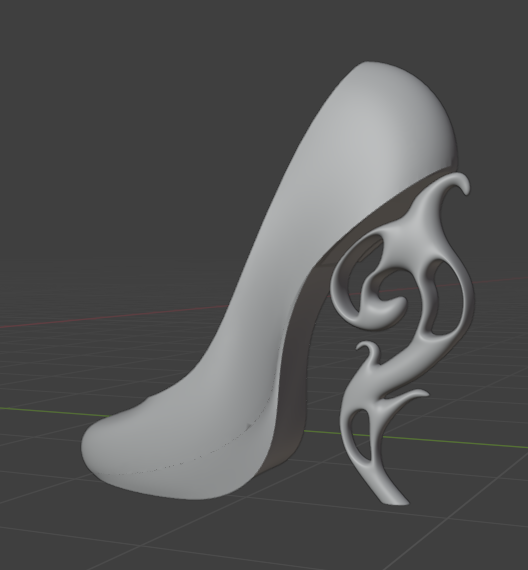
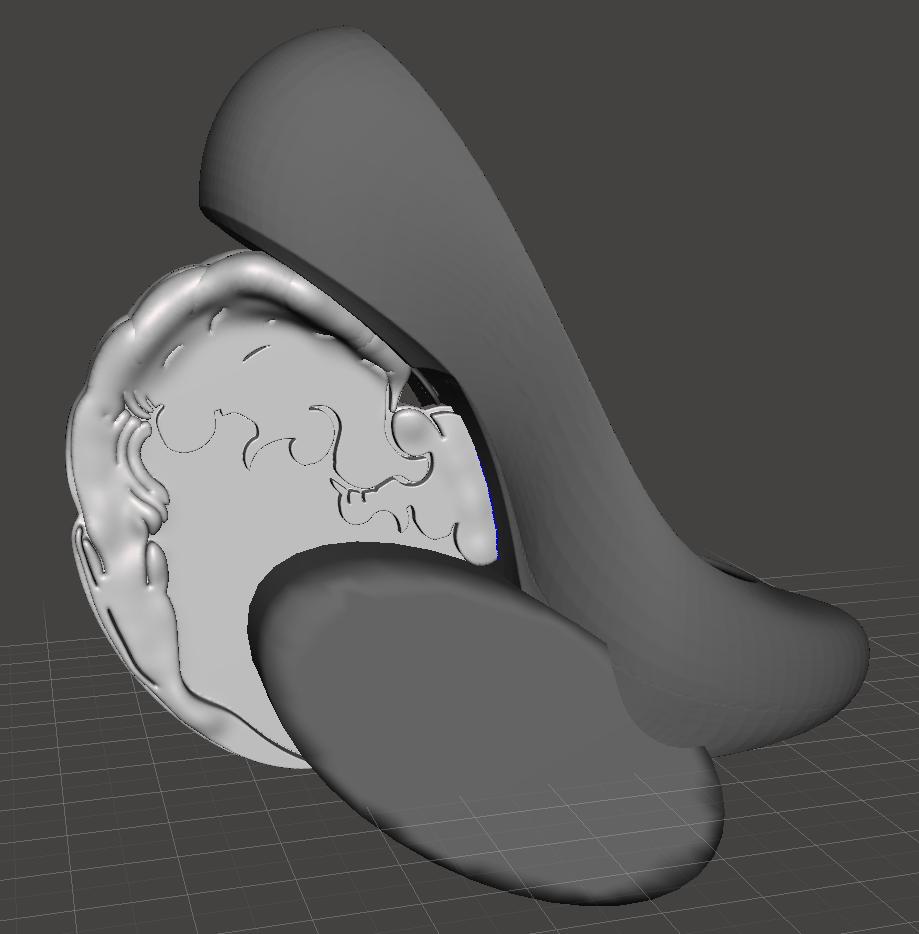
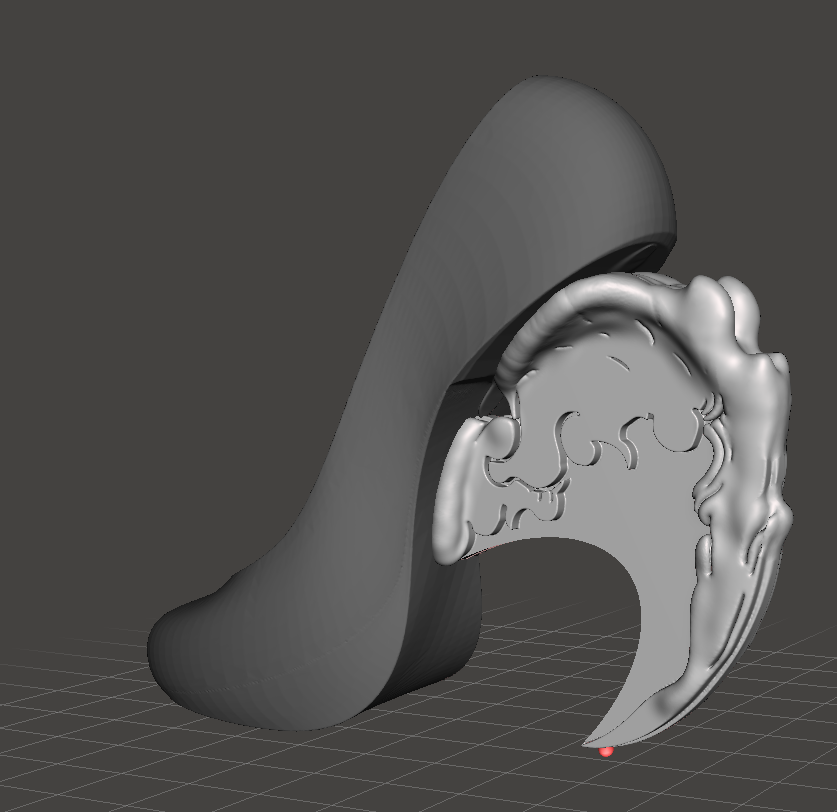
Not at all satisfied with my work I would turn to the aid of Rutgers professor Keary Rossen, whom has extensive experience with 3D work and design. He would introduce me to a new program called Meshmixer, and with some initial guidance I would create a shoe that far better fit my initial ideas of a flowing wave.
The People
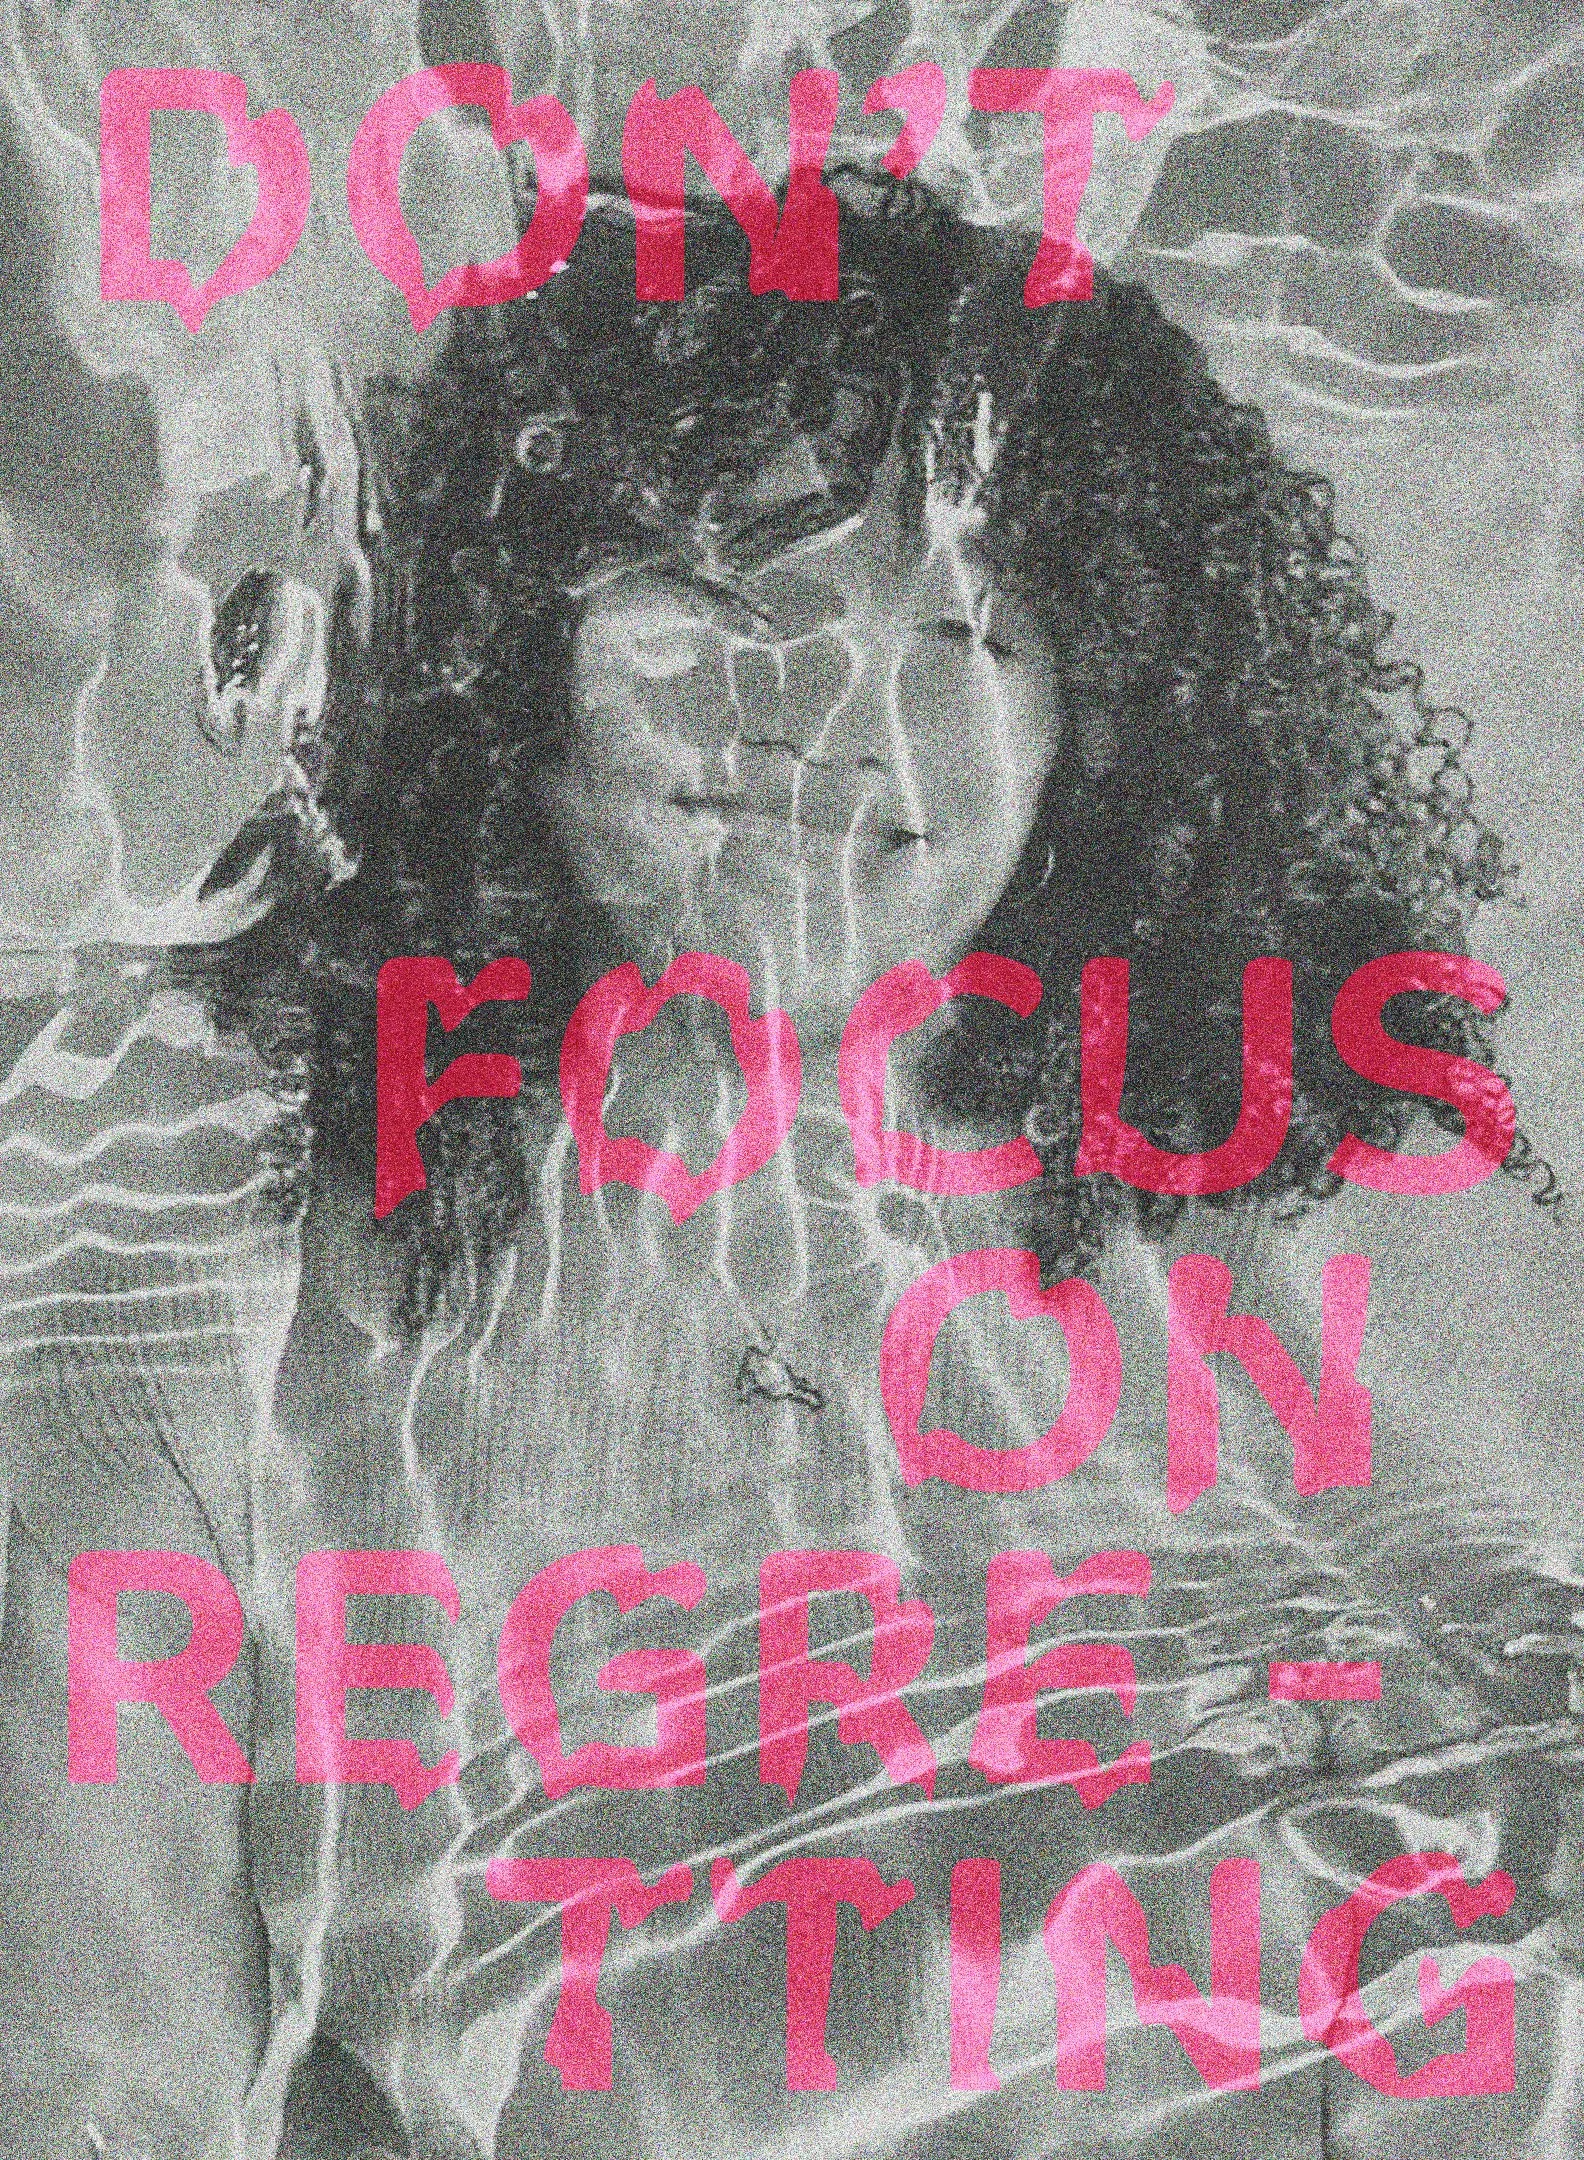
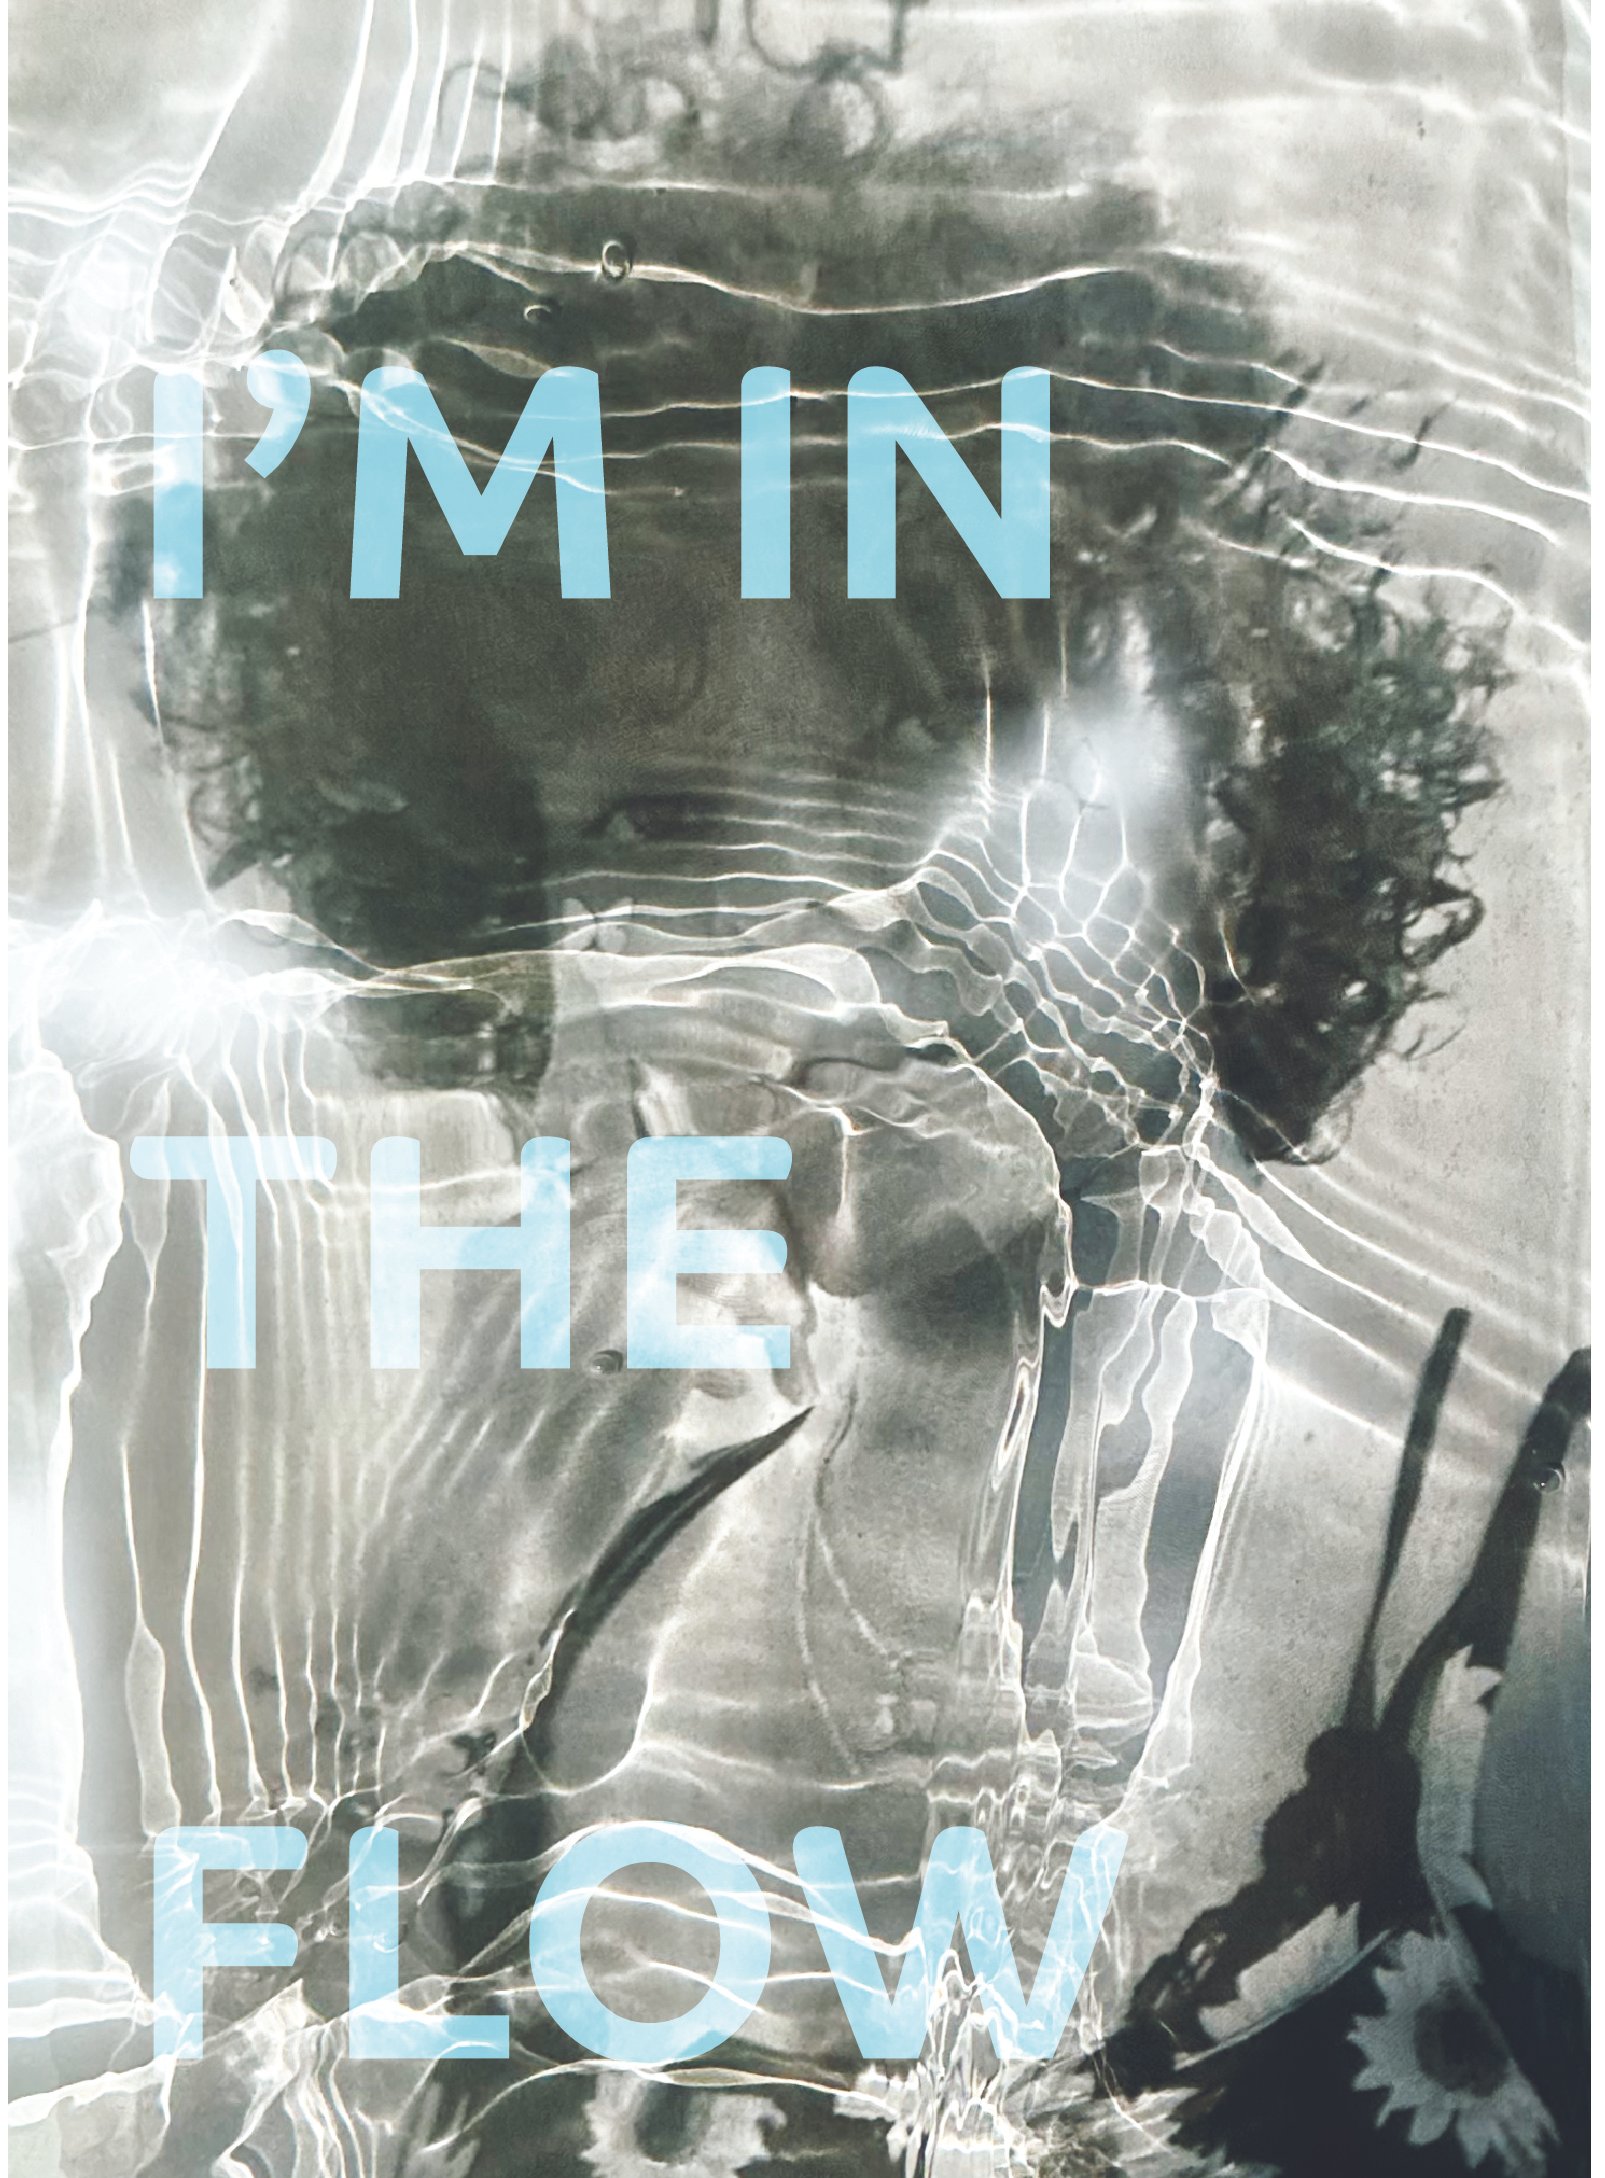
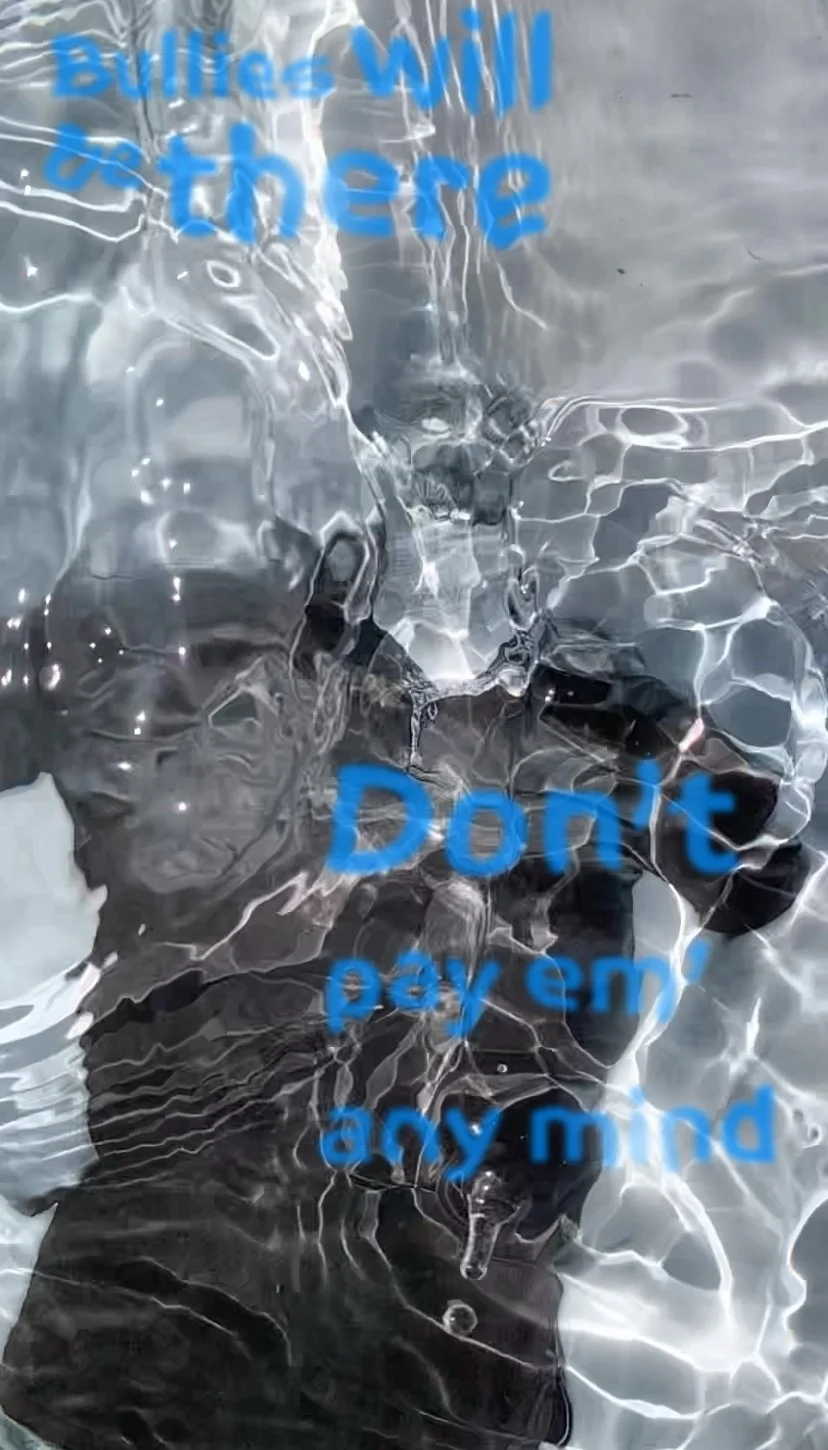
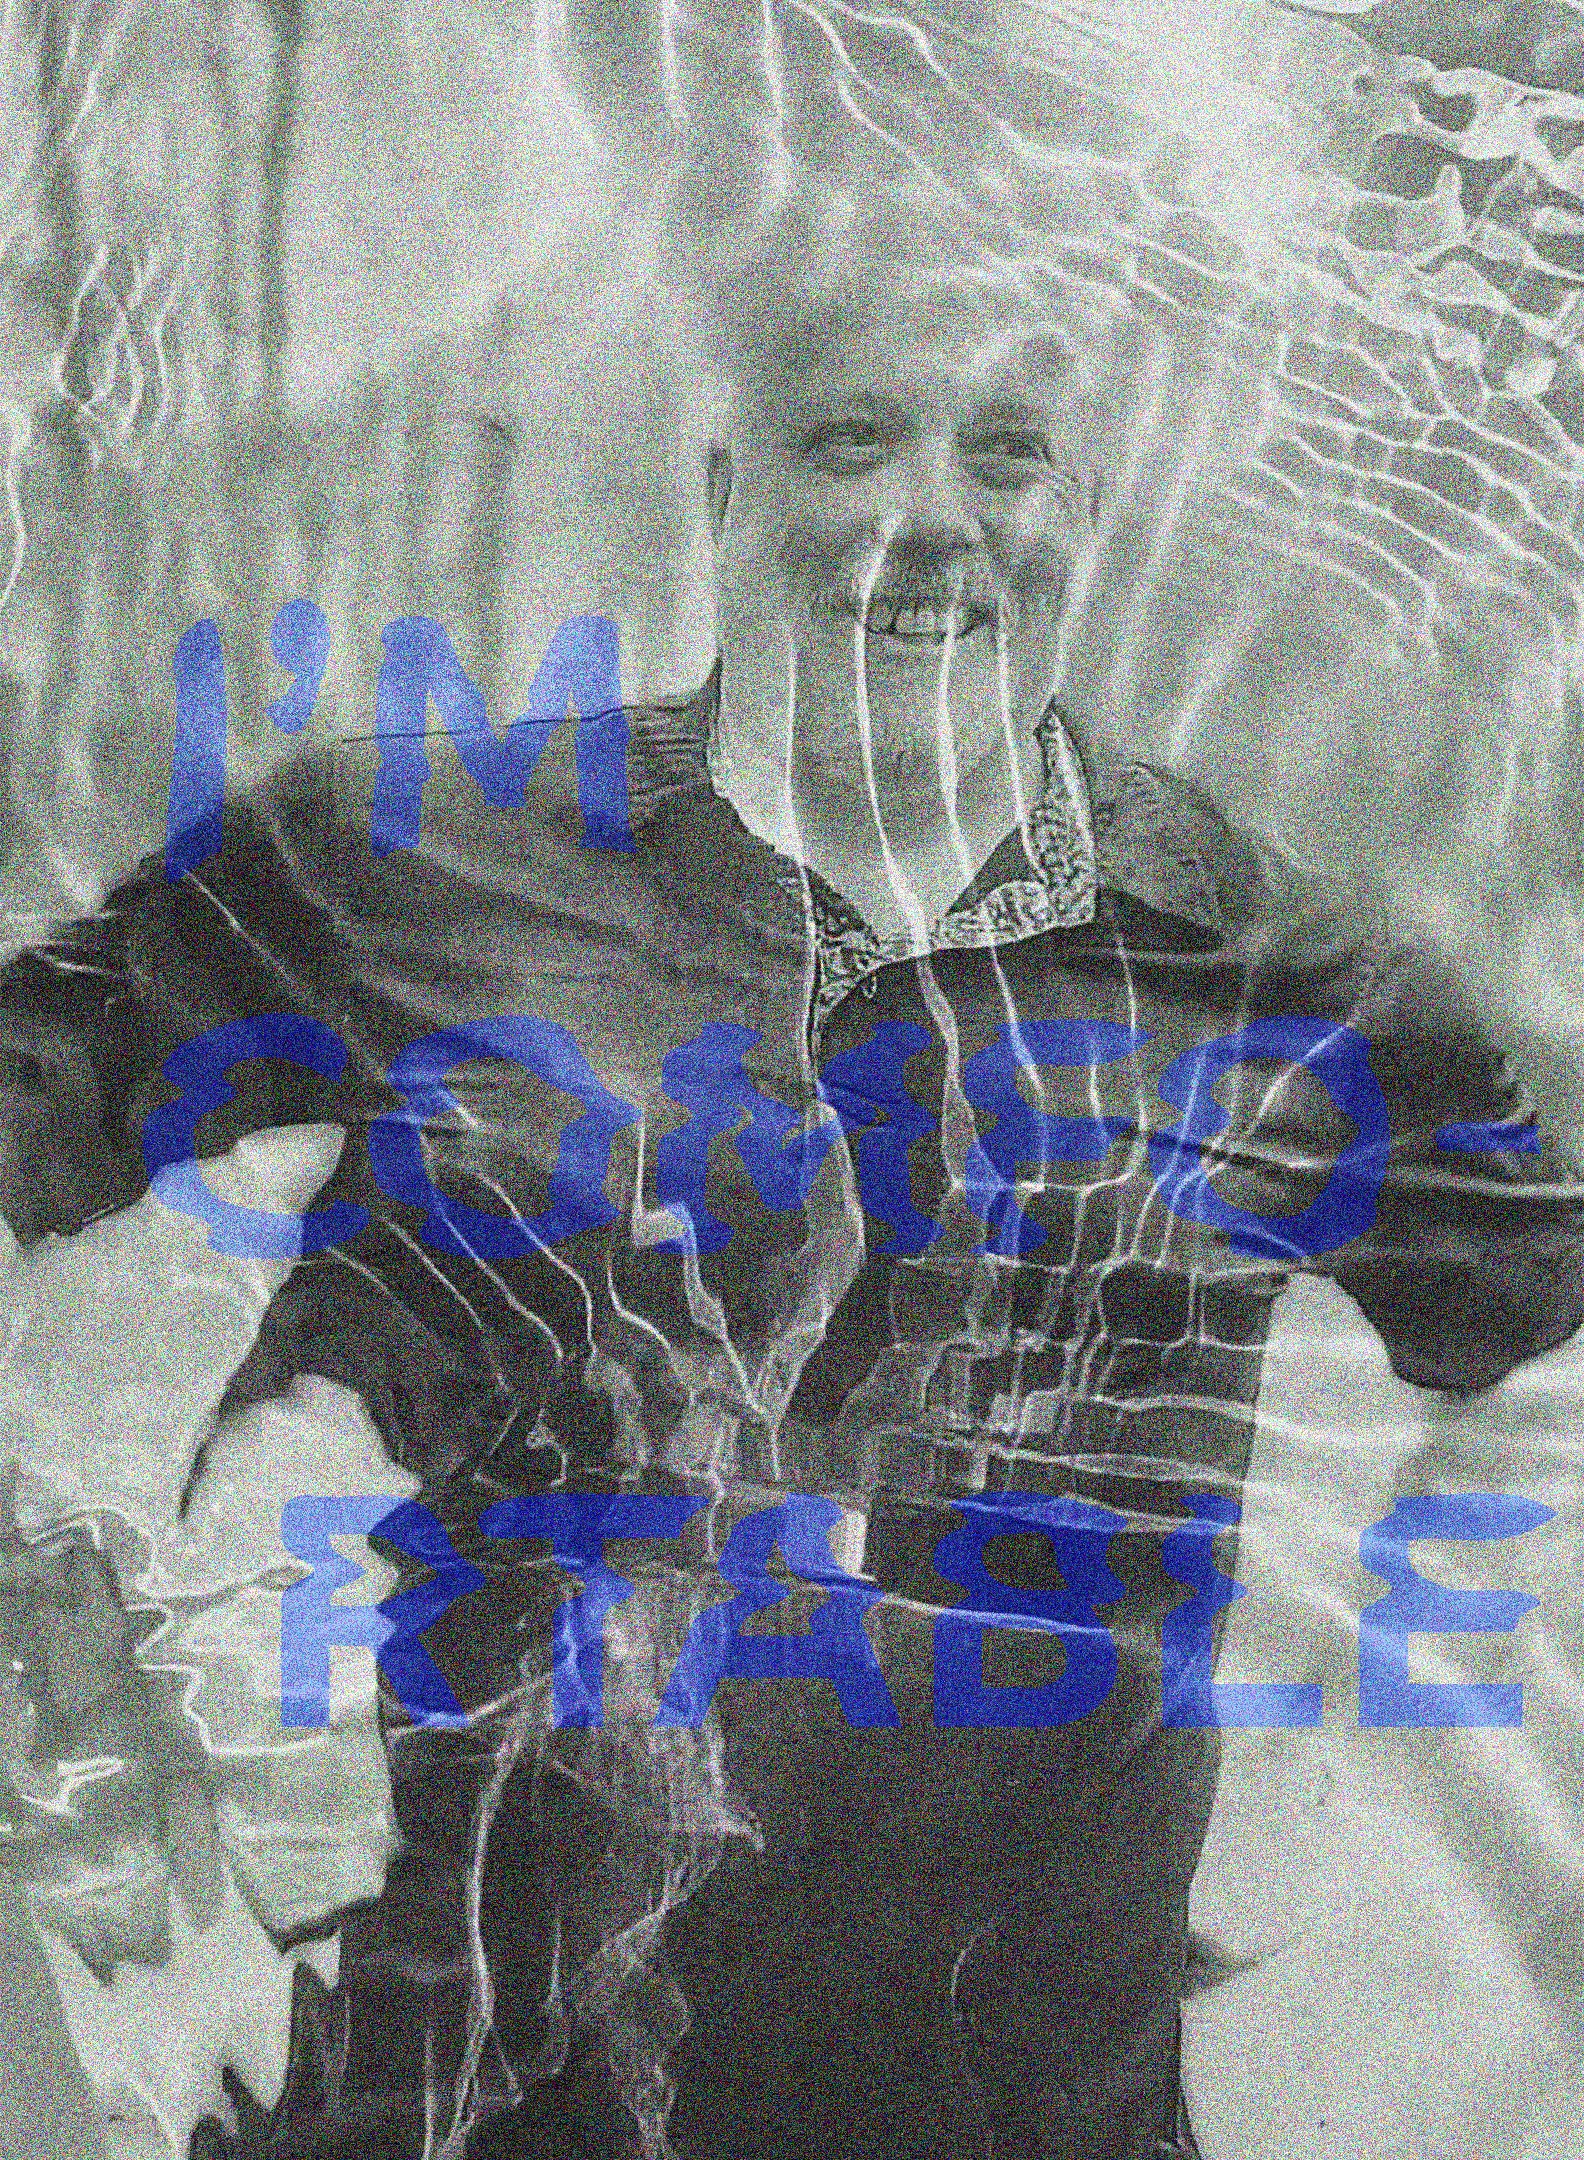
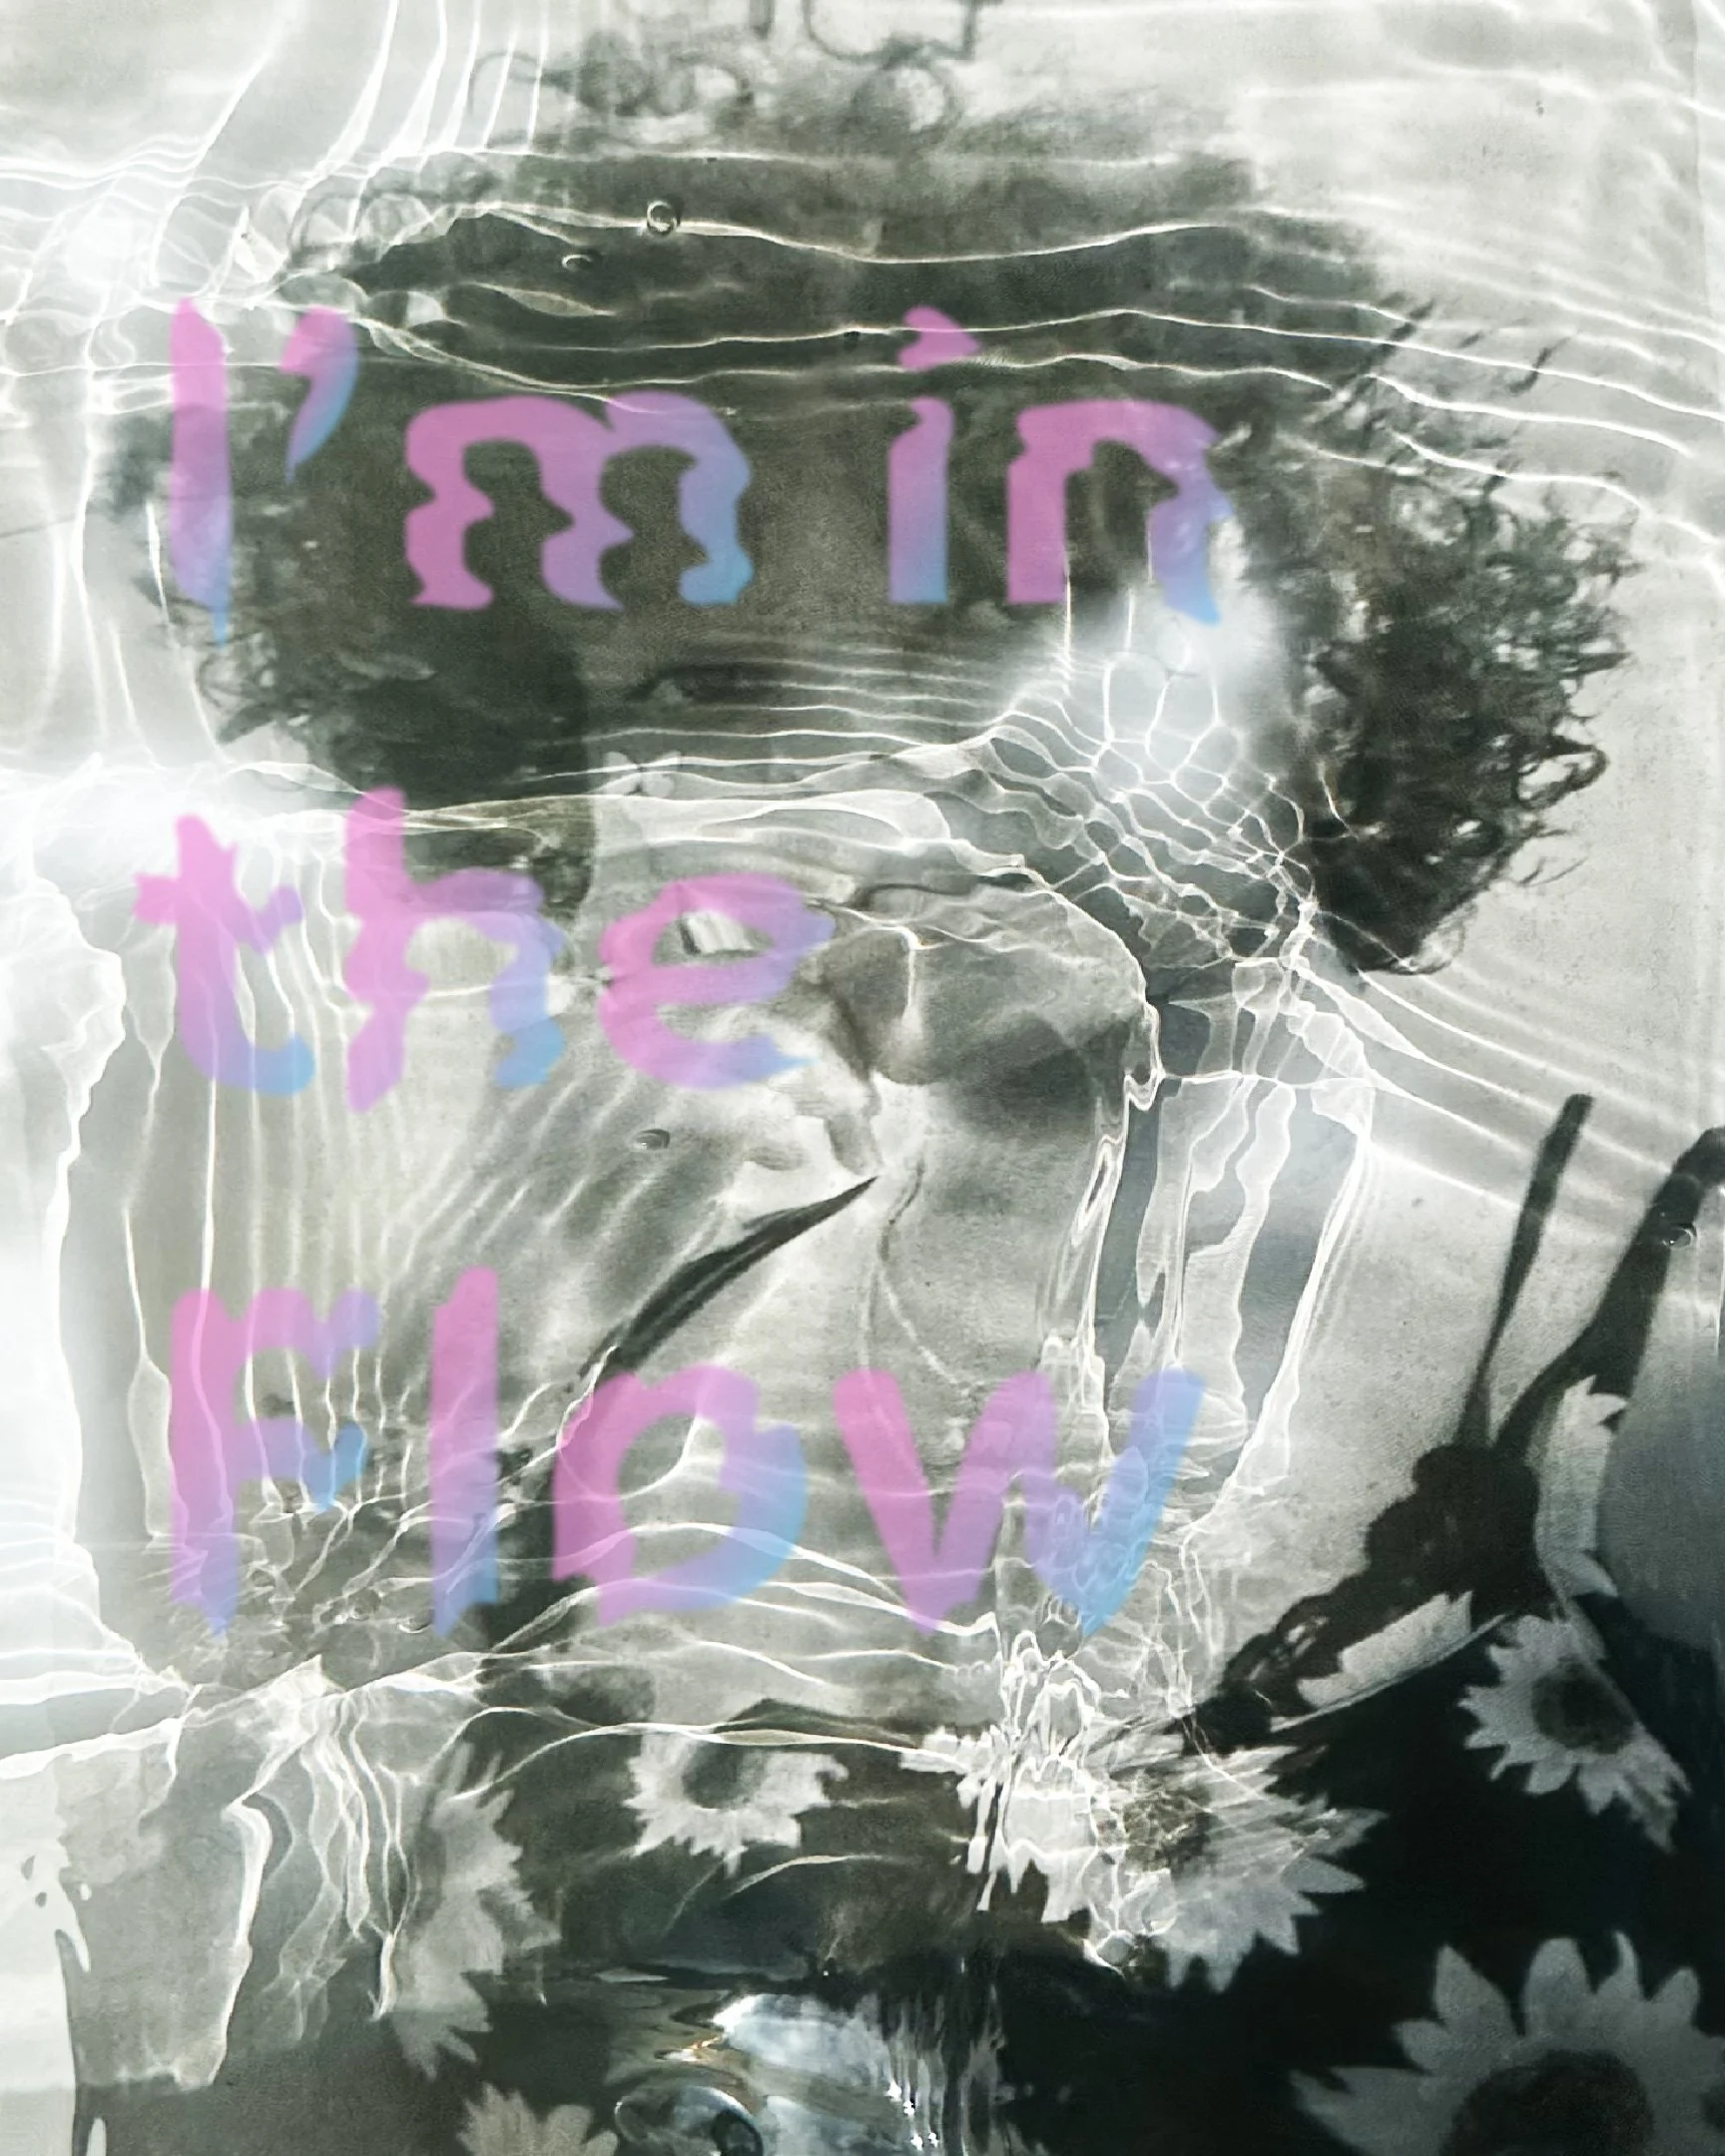
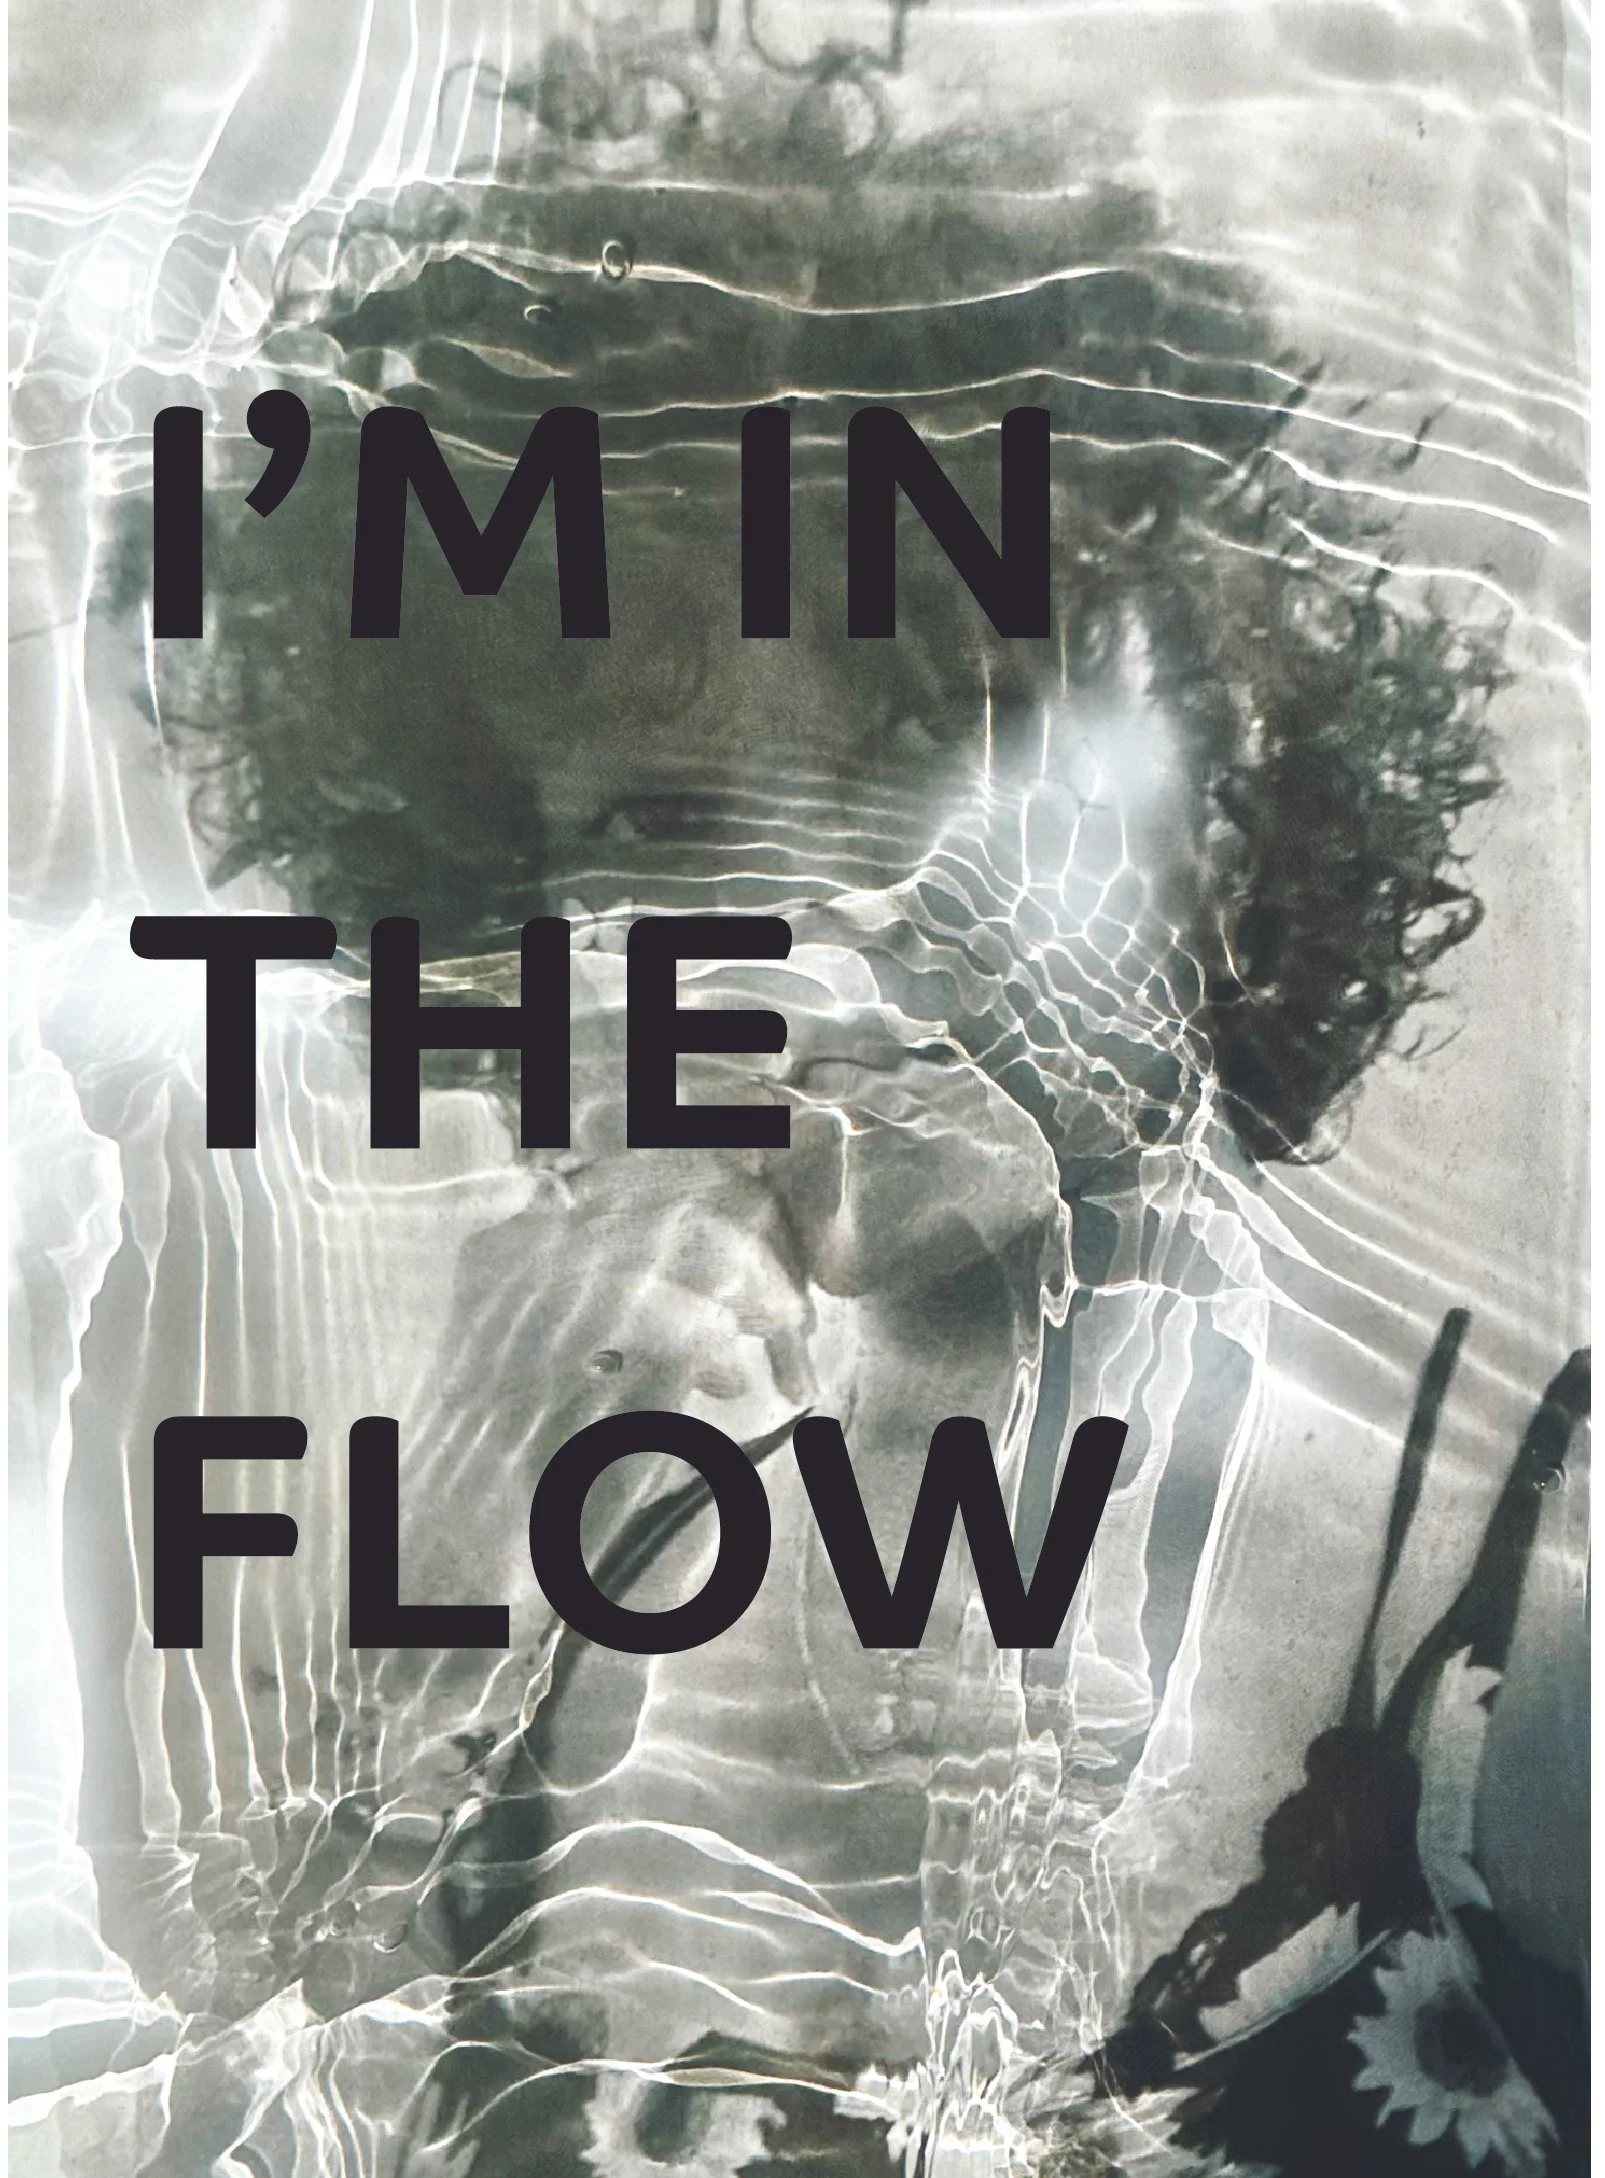
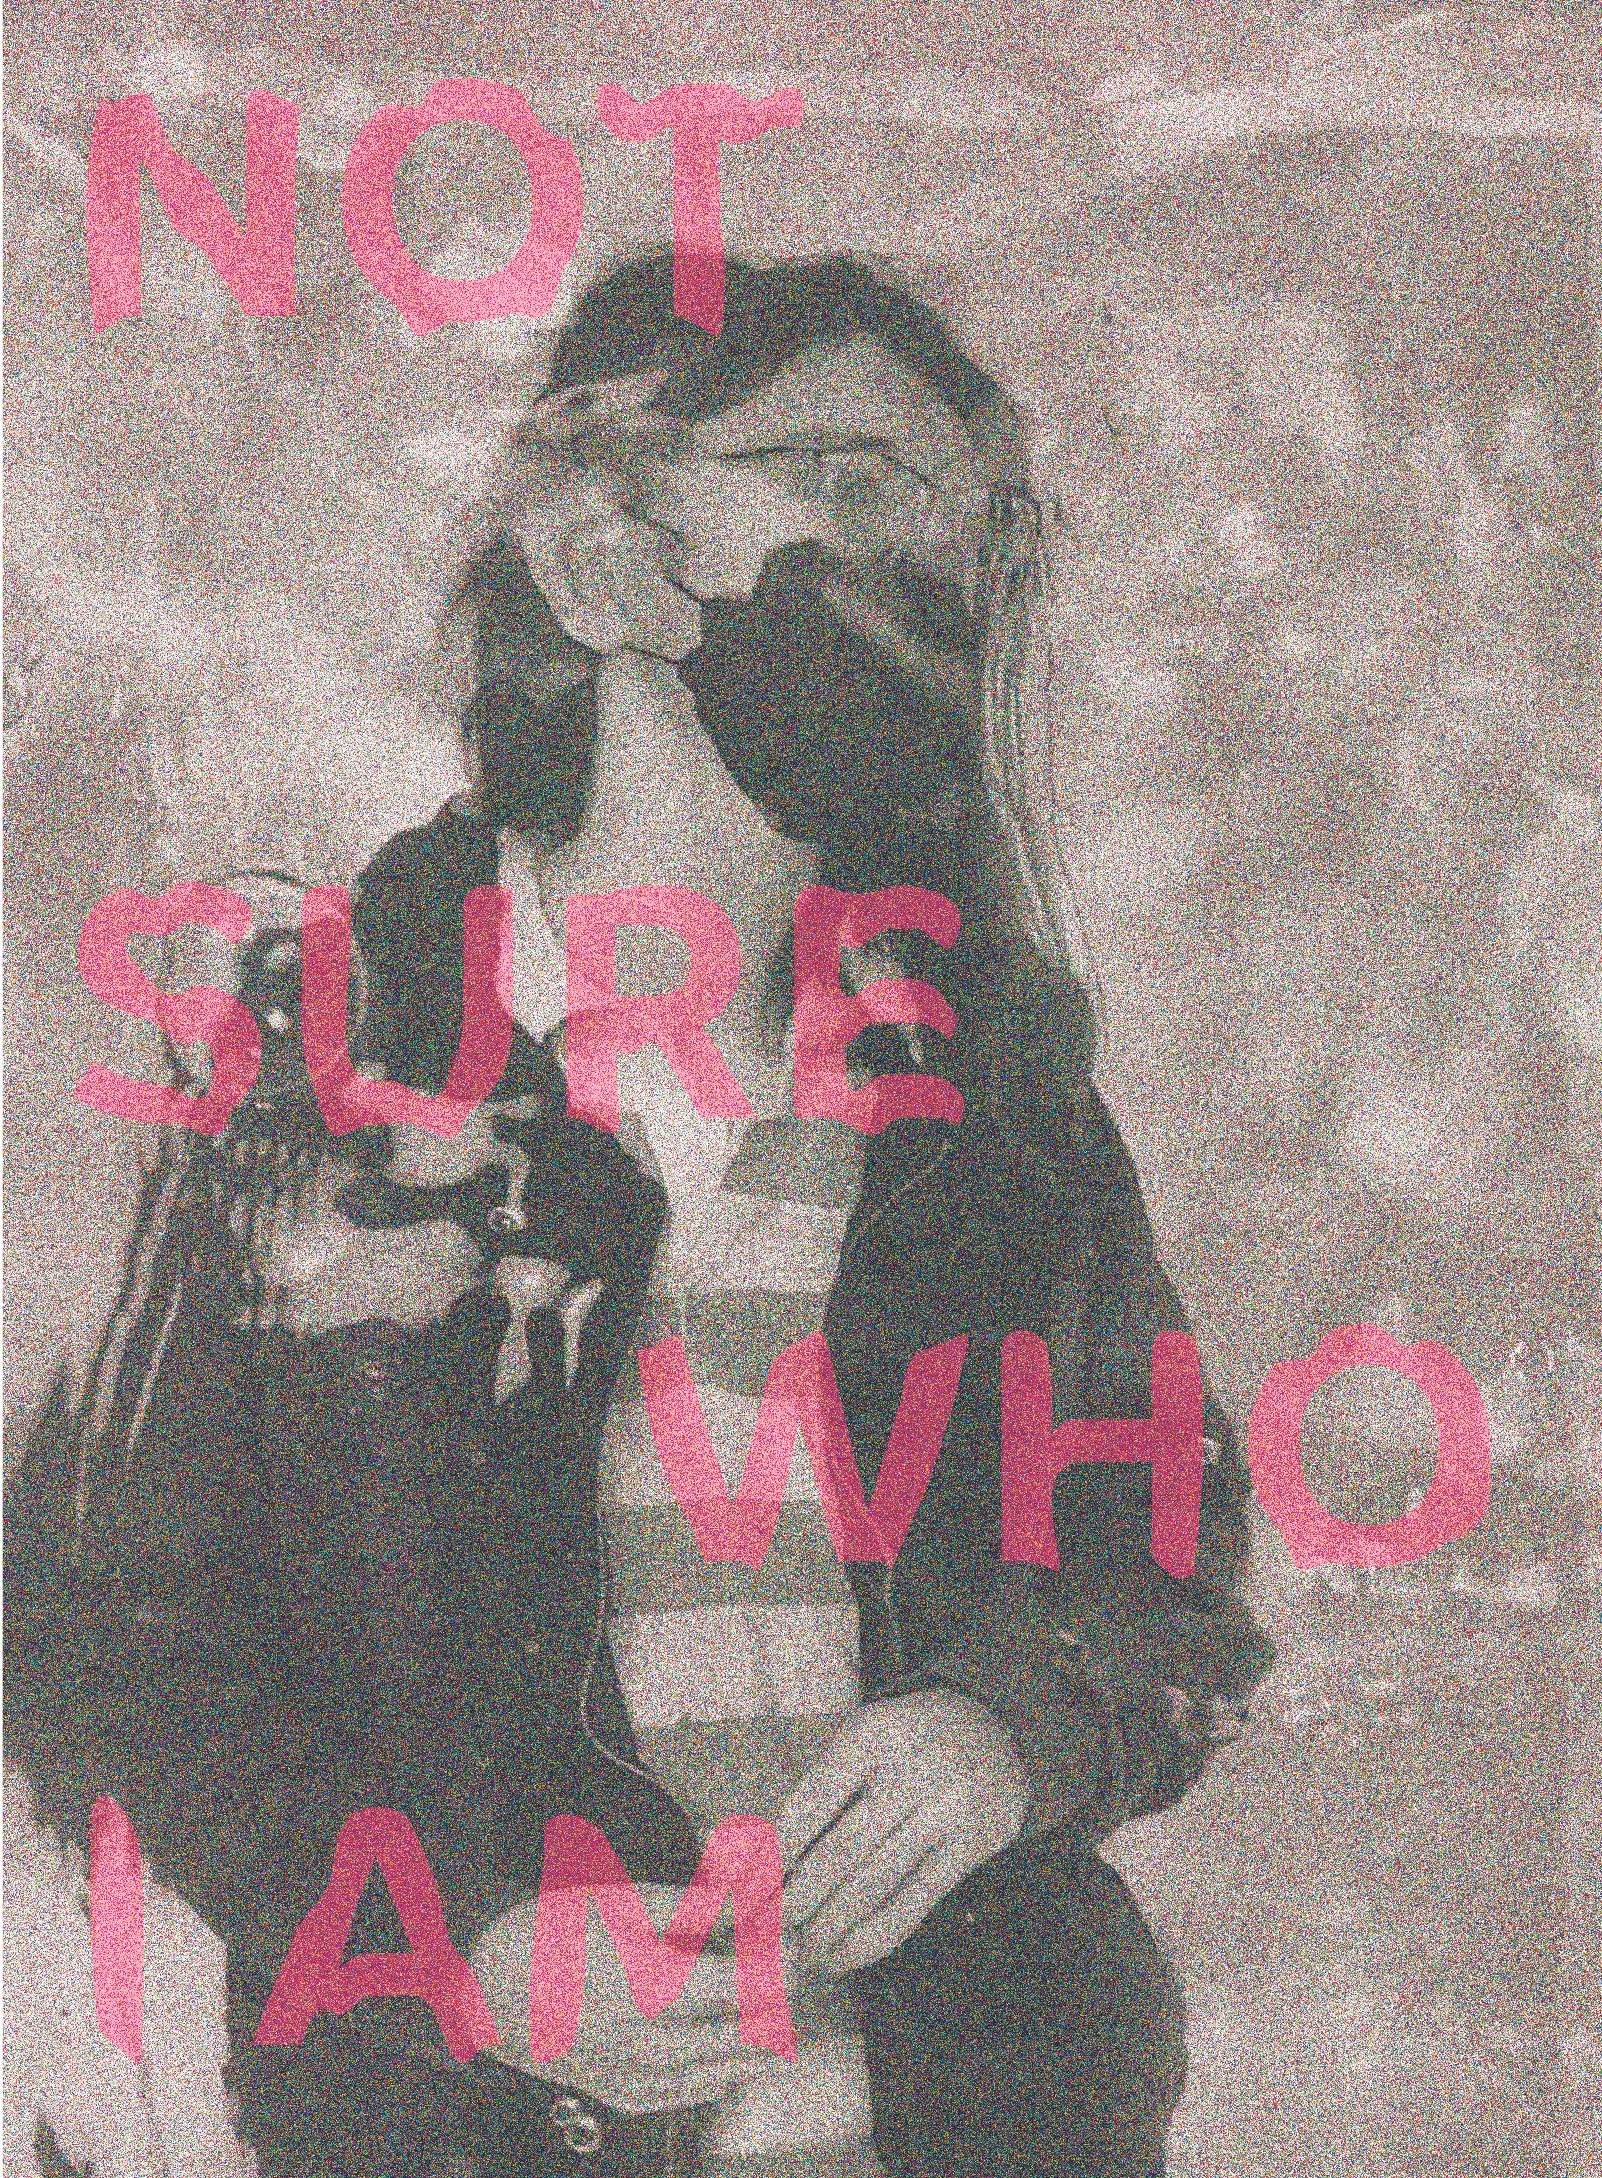
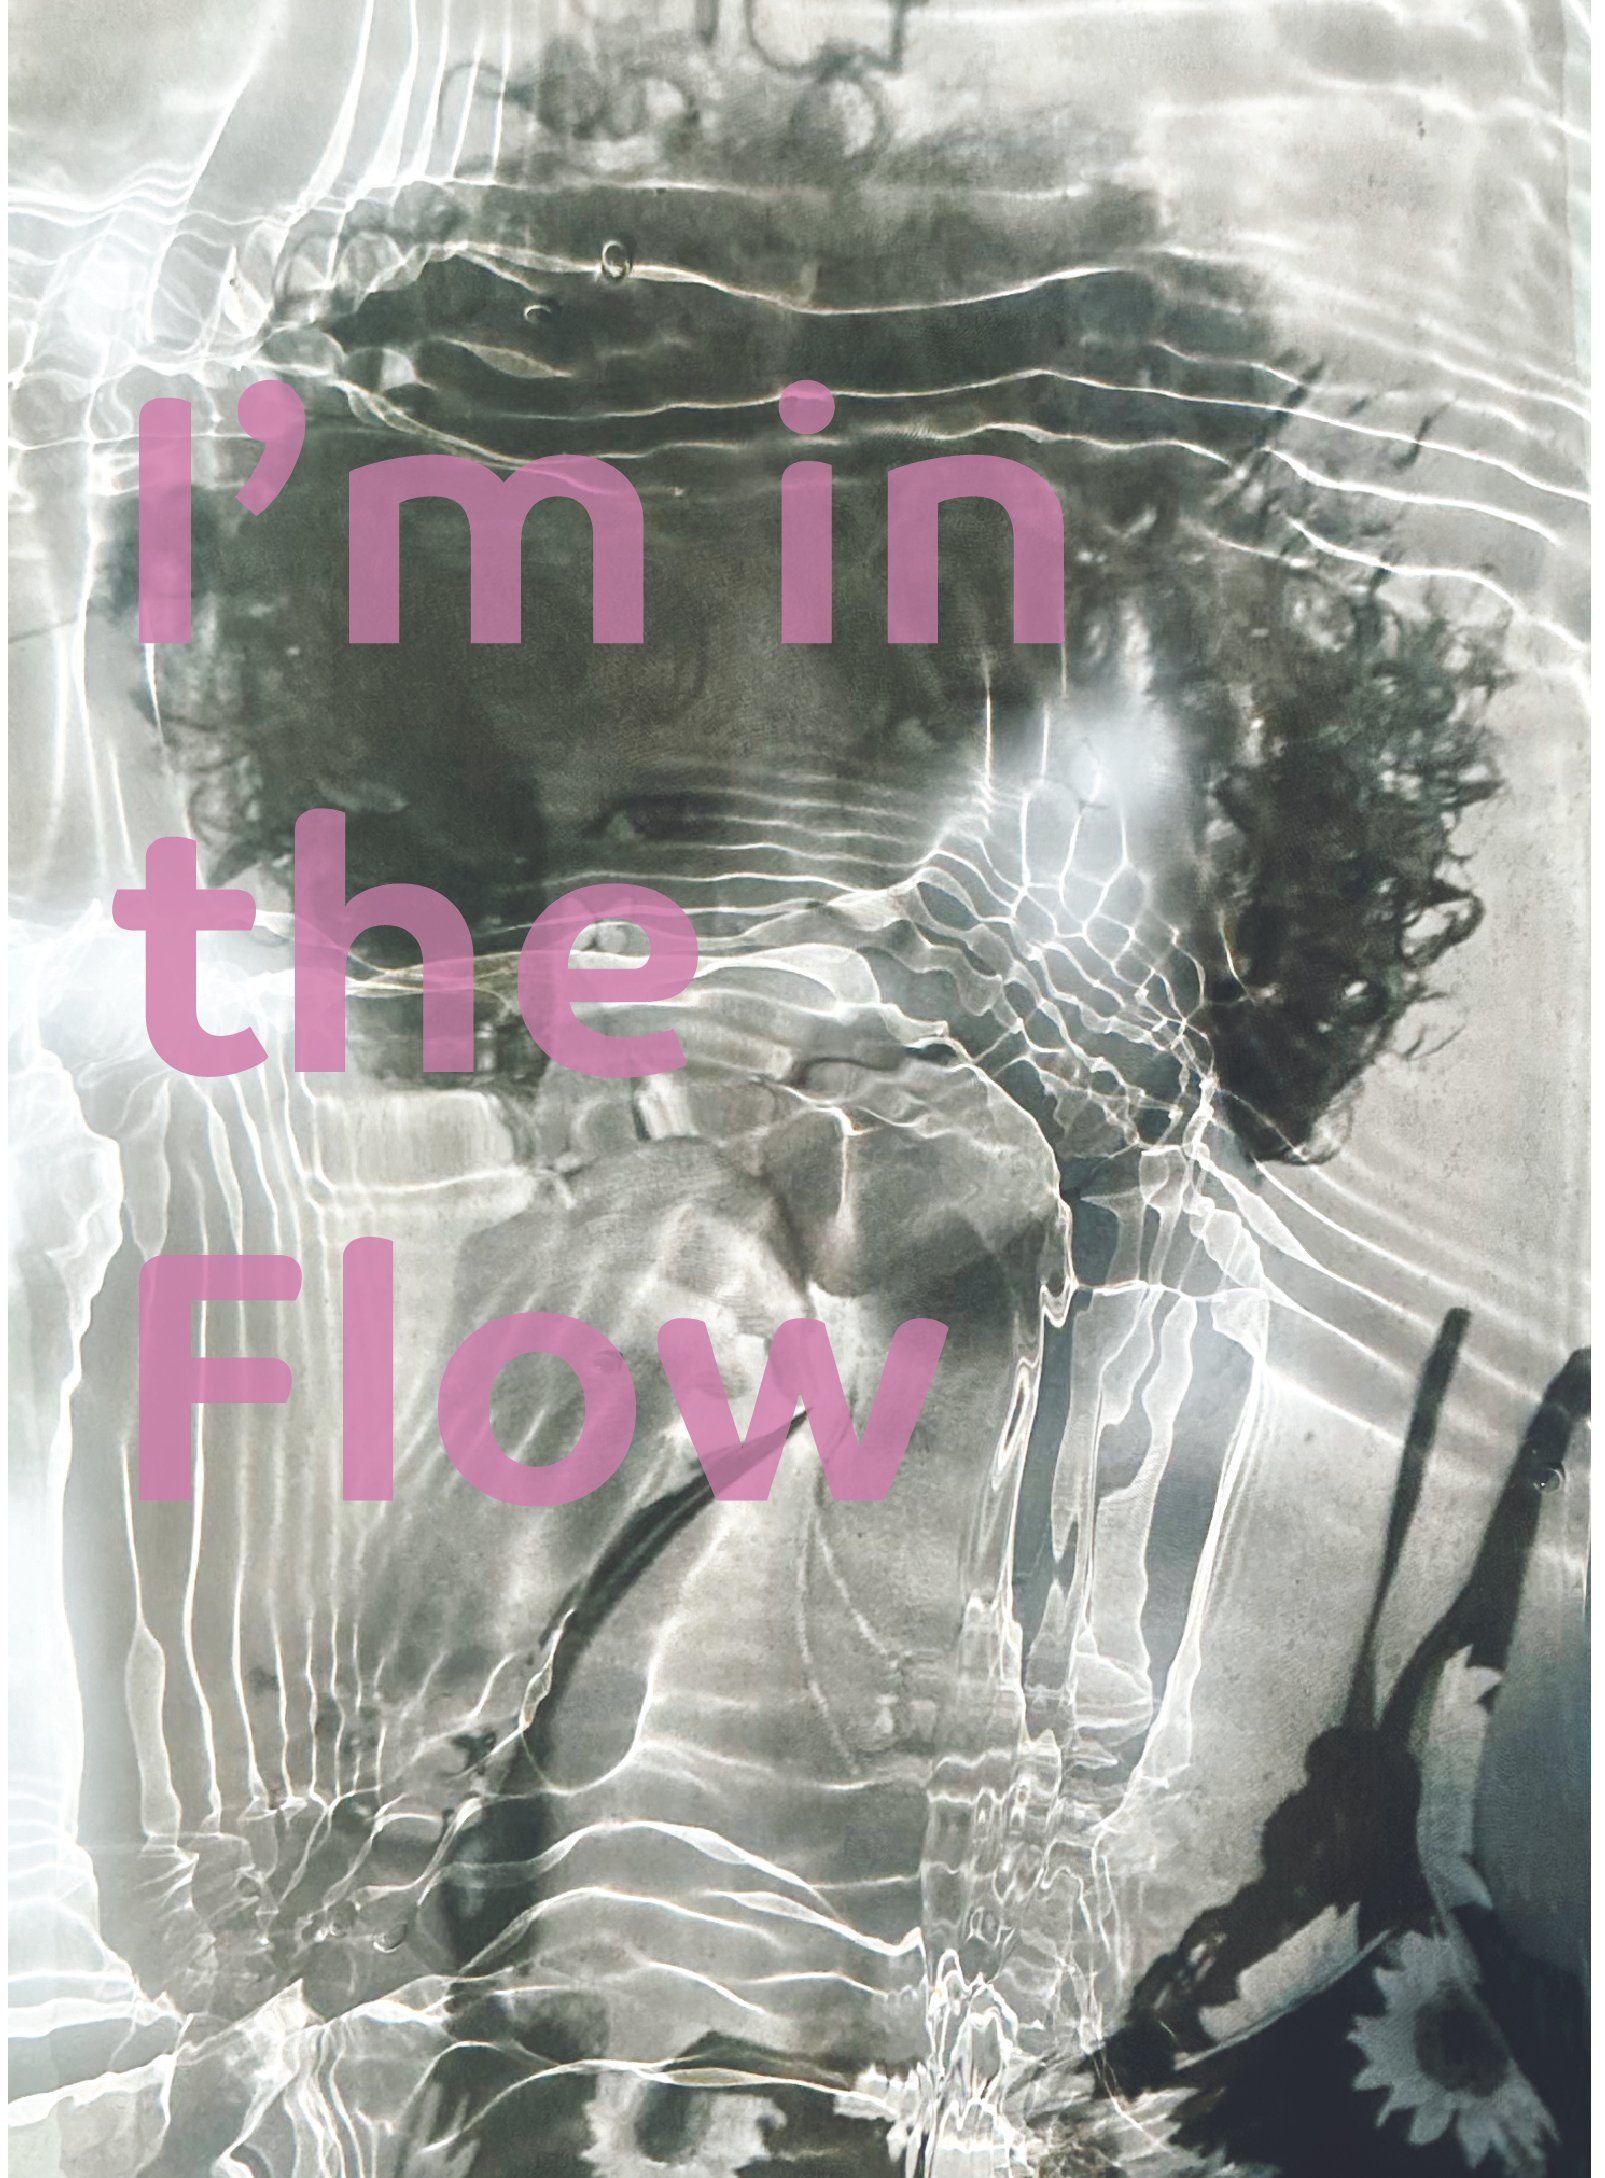
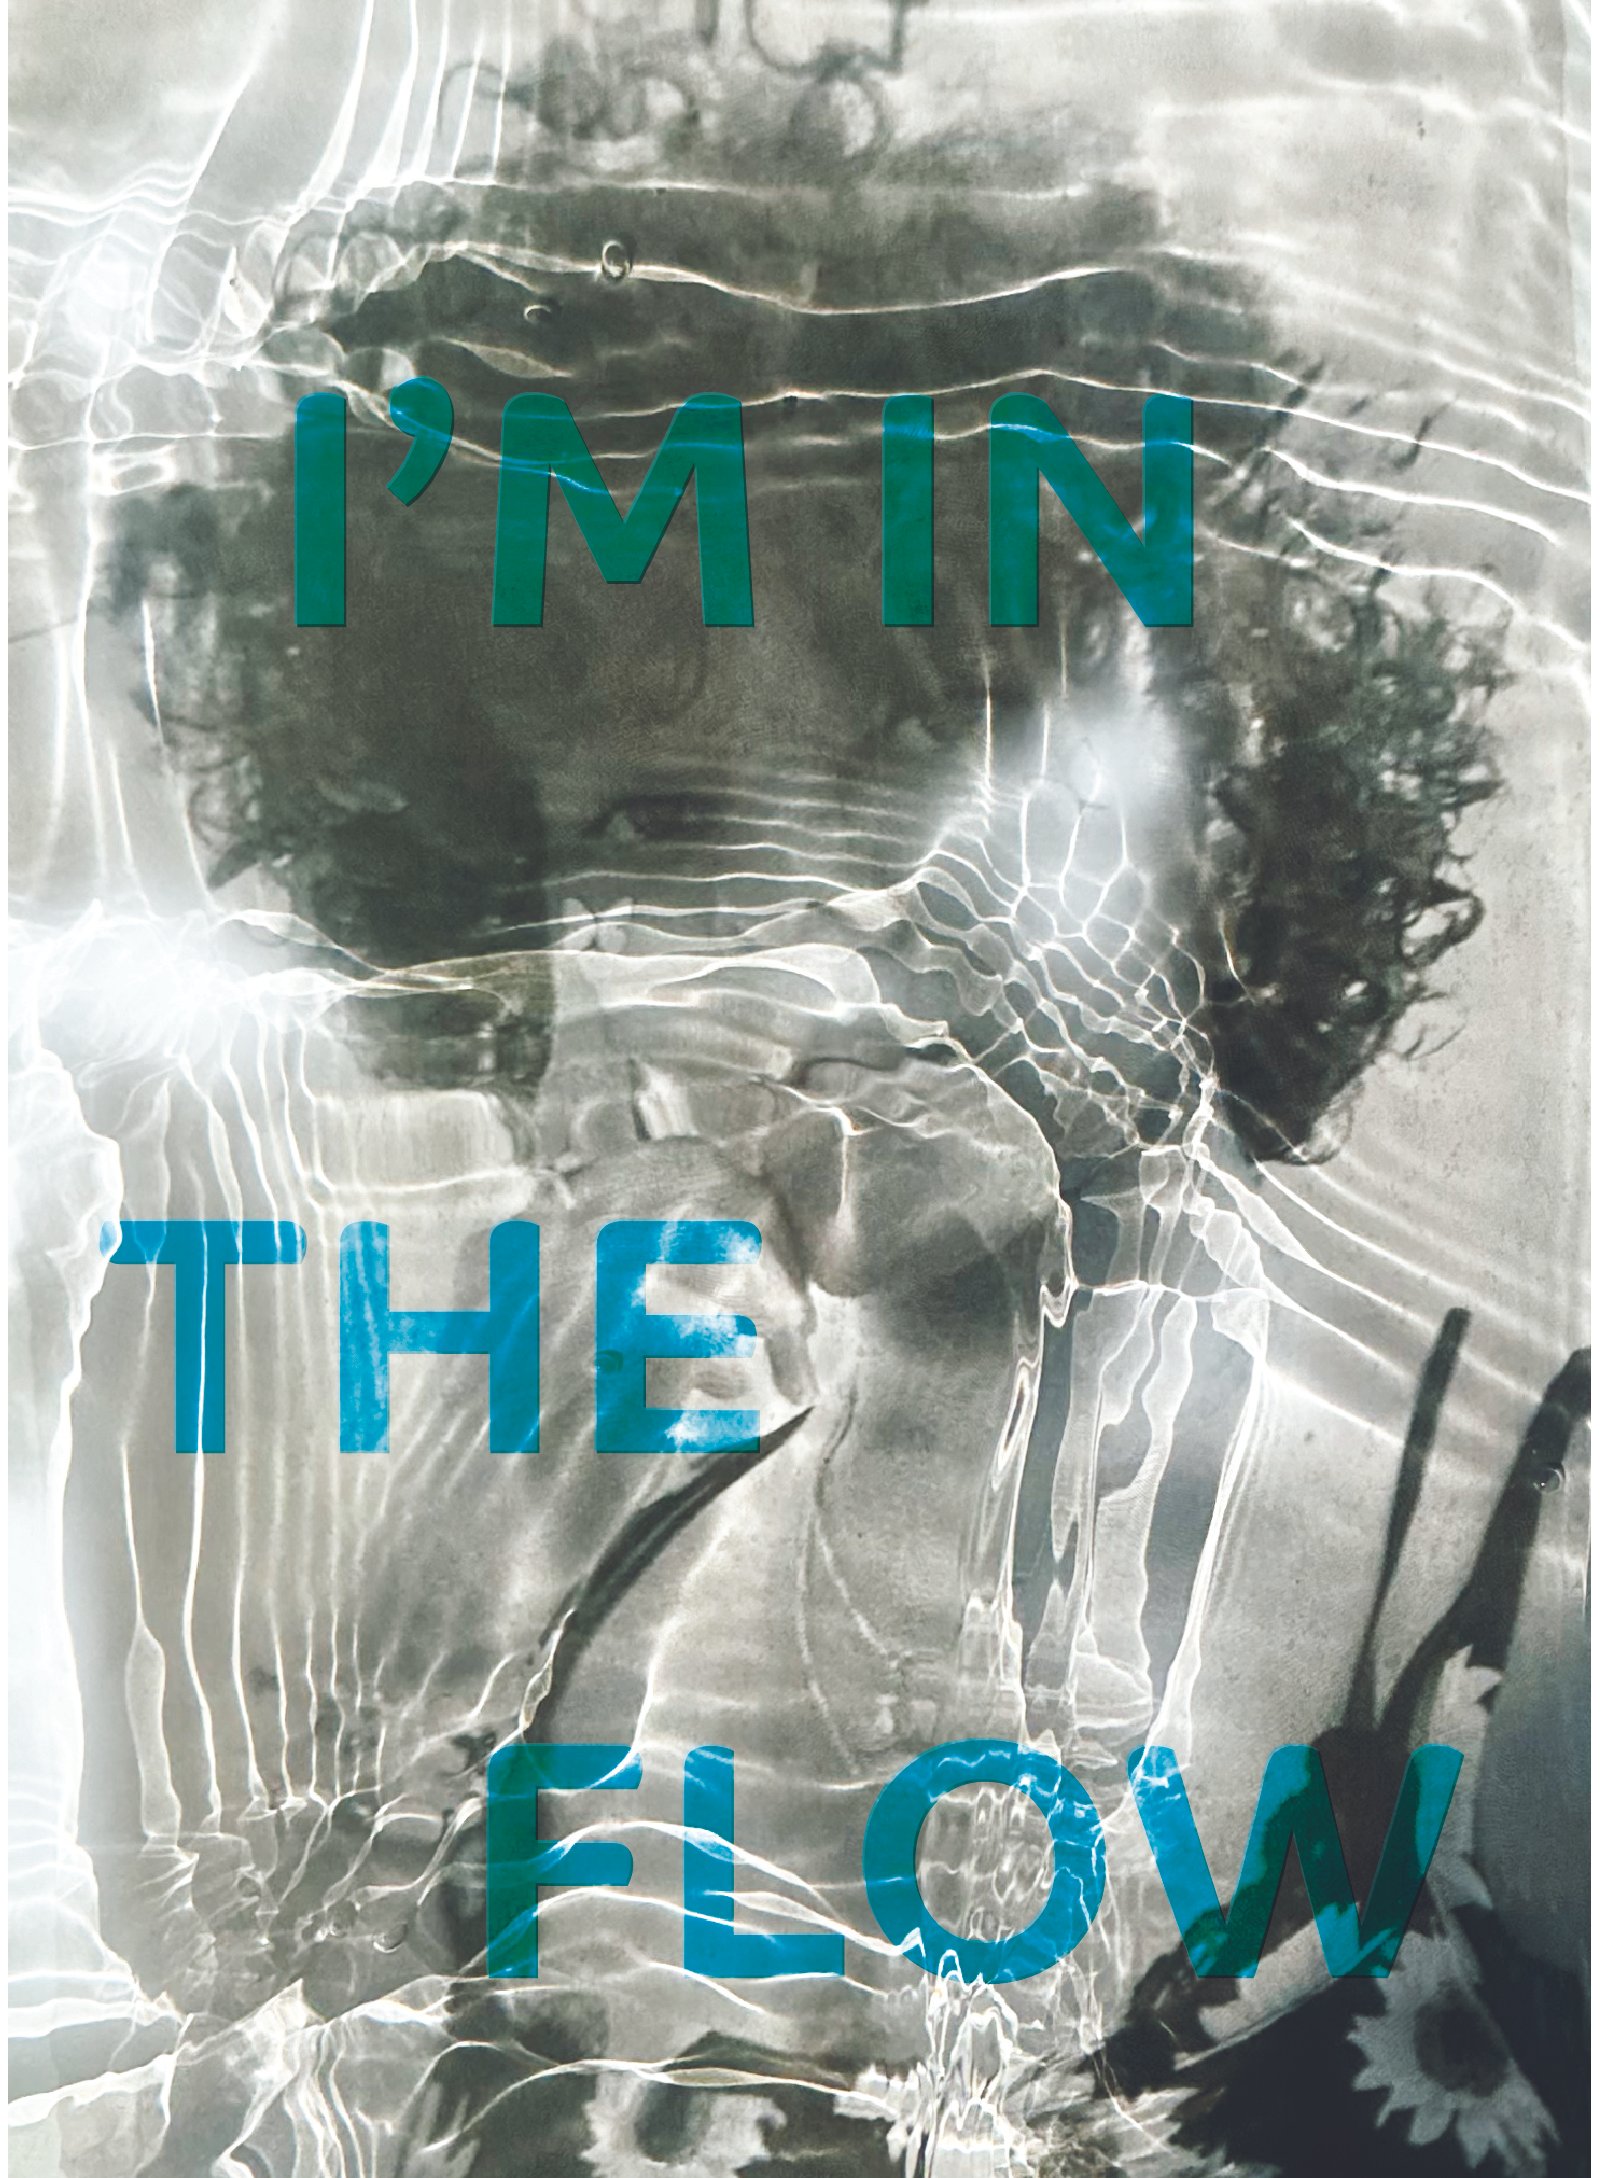
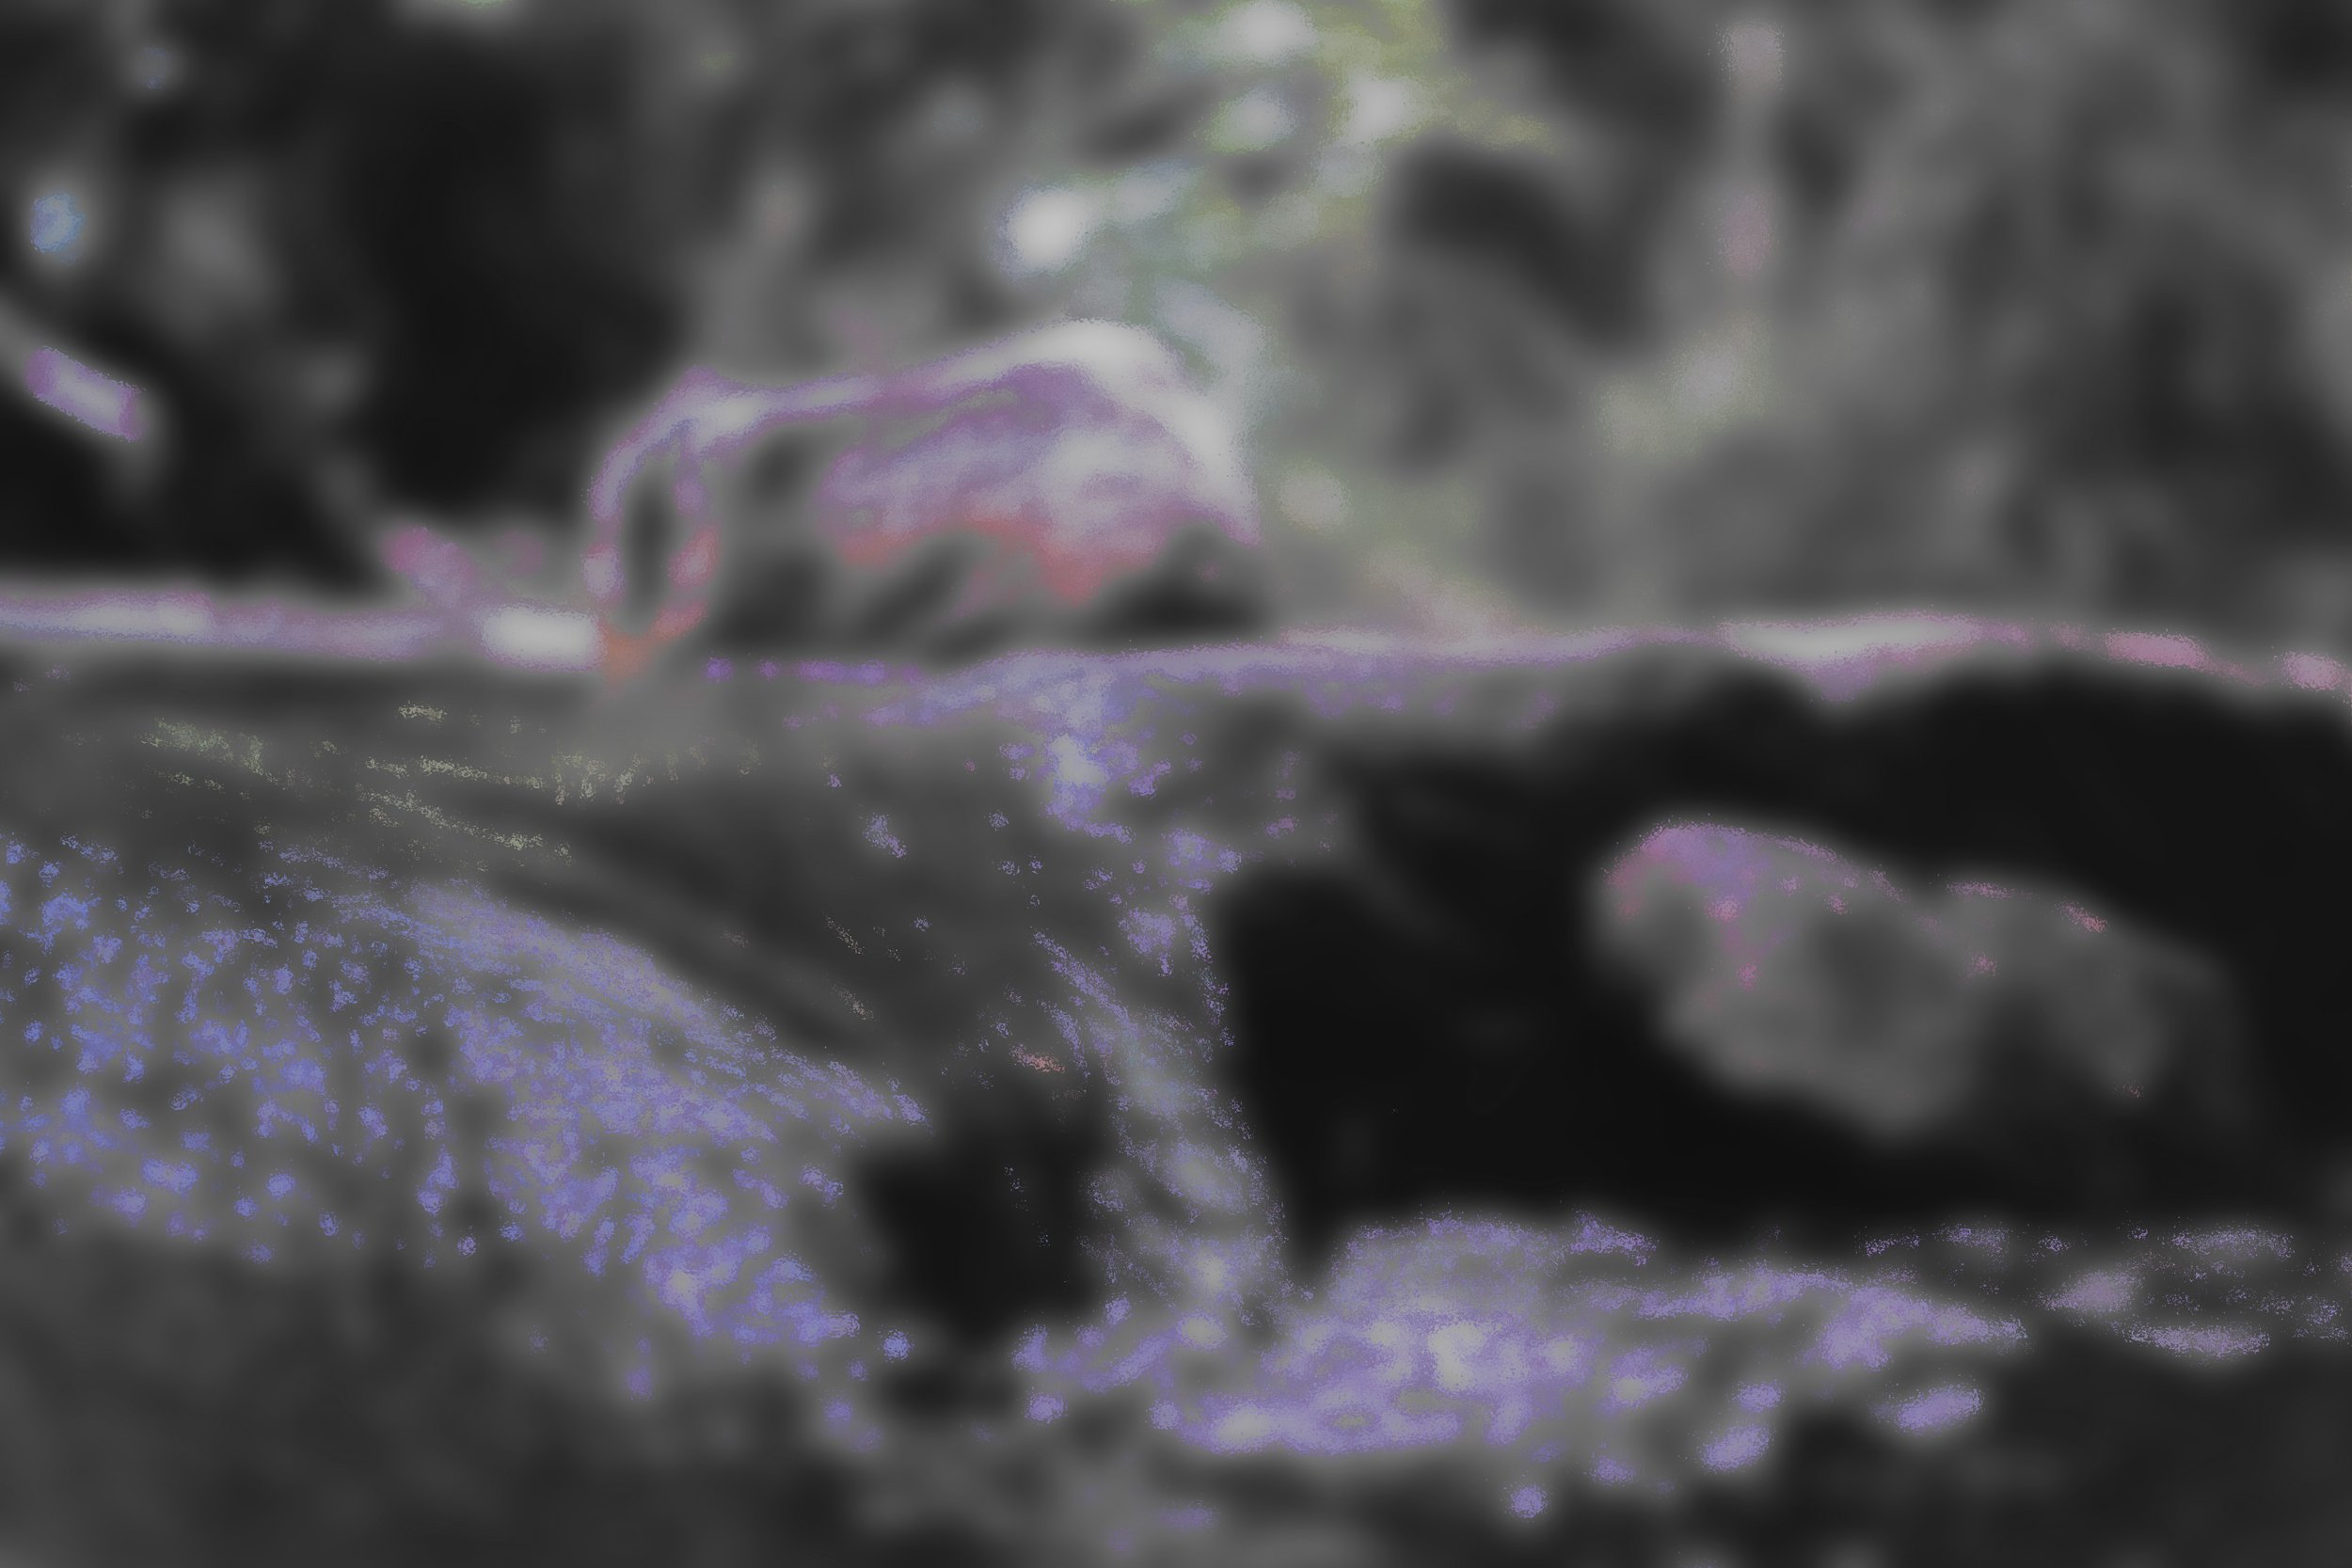
This project was to reach out to those who have had experiences in their lives at some point where they felt unsure of themselves in some way. Then I would interview the individuals, and use photos of them obscured by water to bring out the effect of their uncertainty.
The People illustrator testing
After deciding which images that I would end up using for the posters I would then move to my experimentations in illustrator trying to create a methodology to my pieces so that I could bring them all together.
The Data
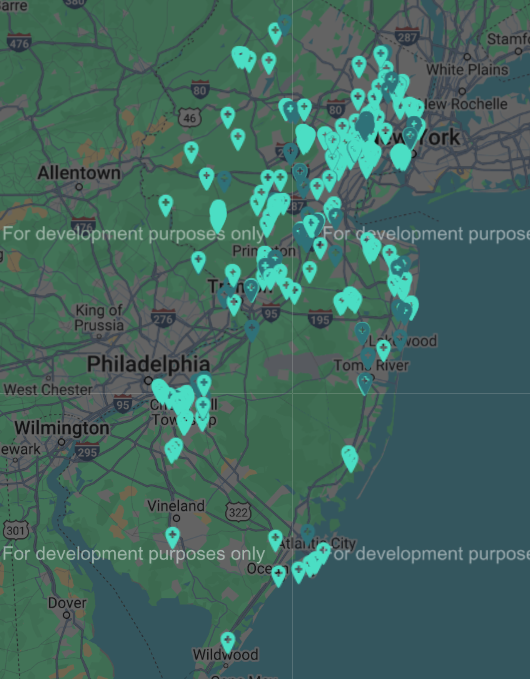
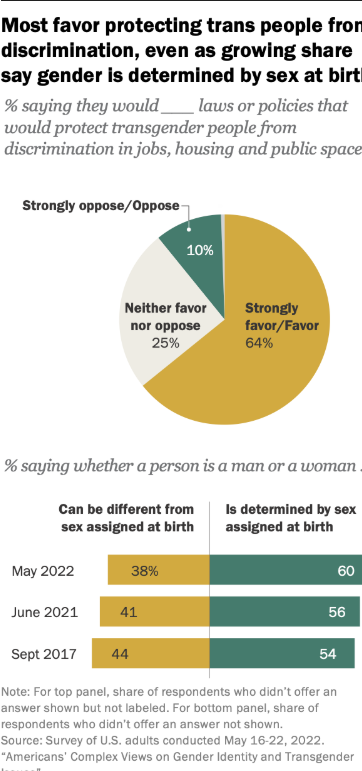
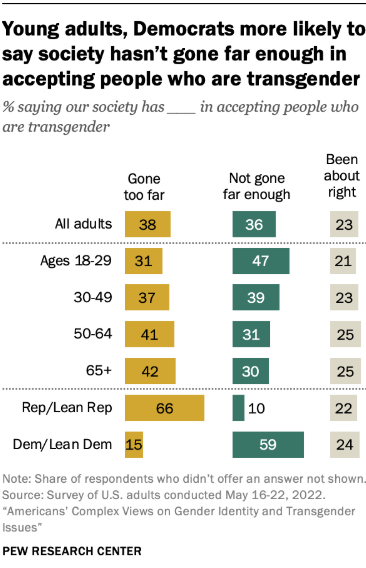
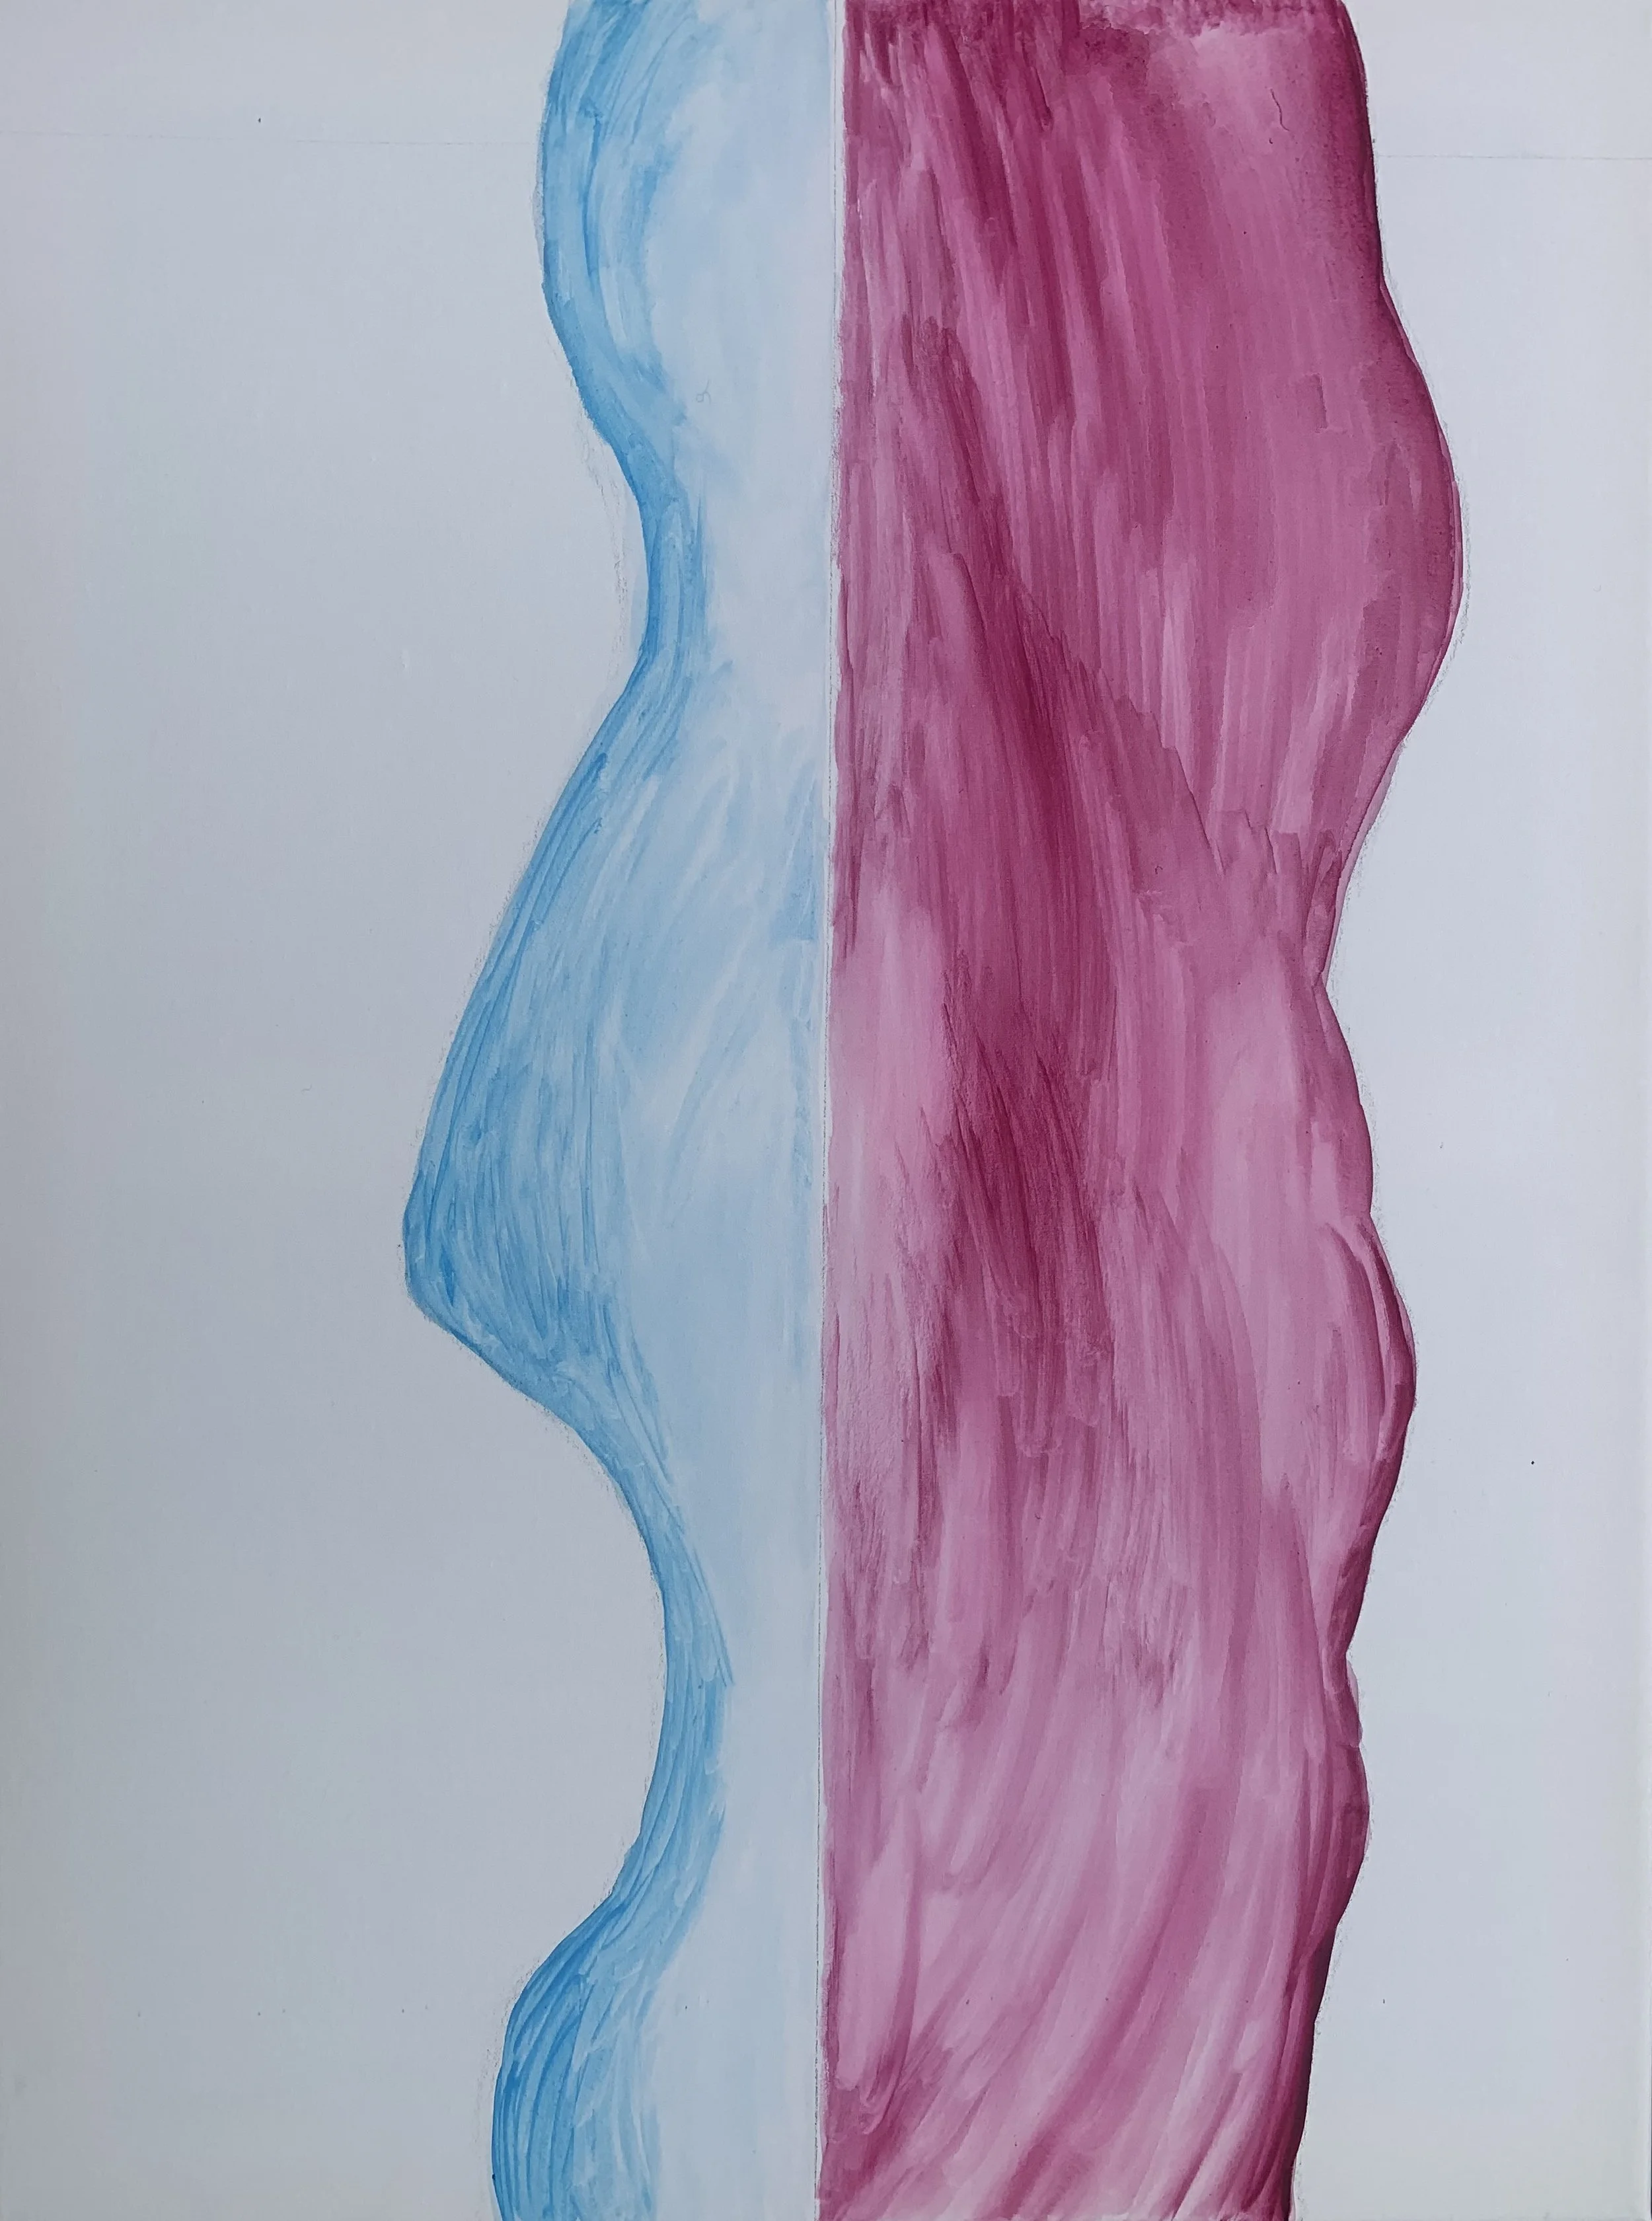
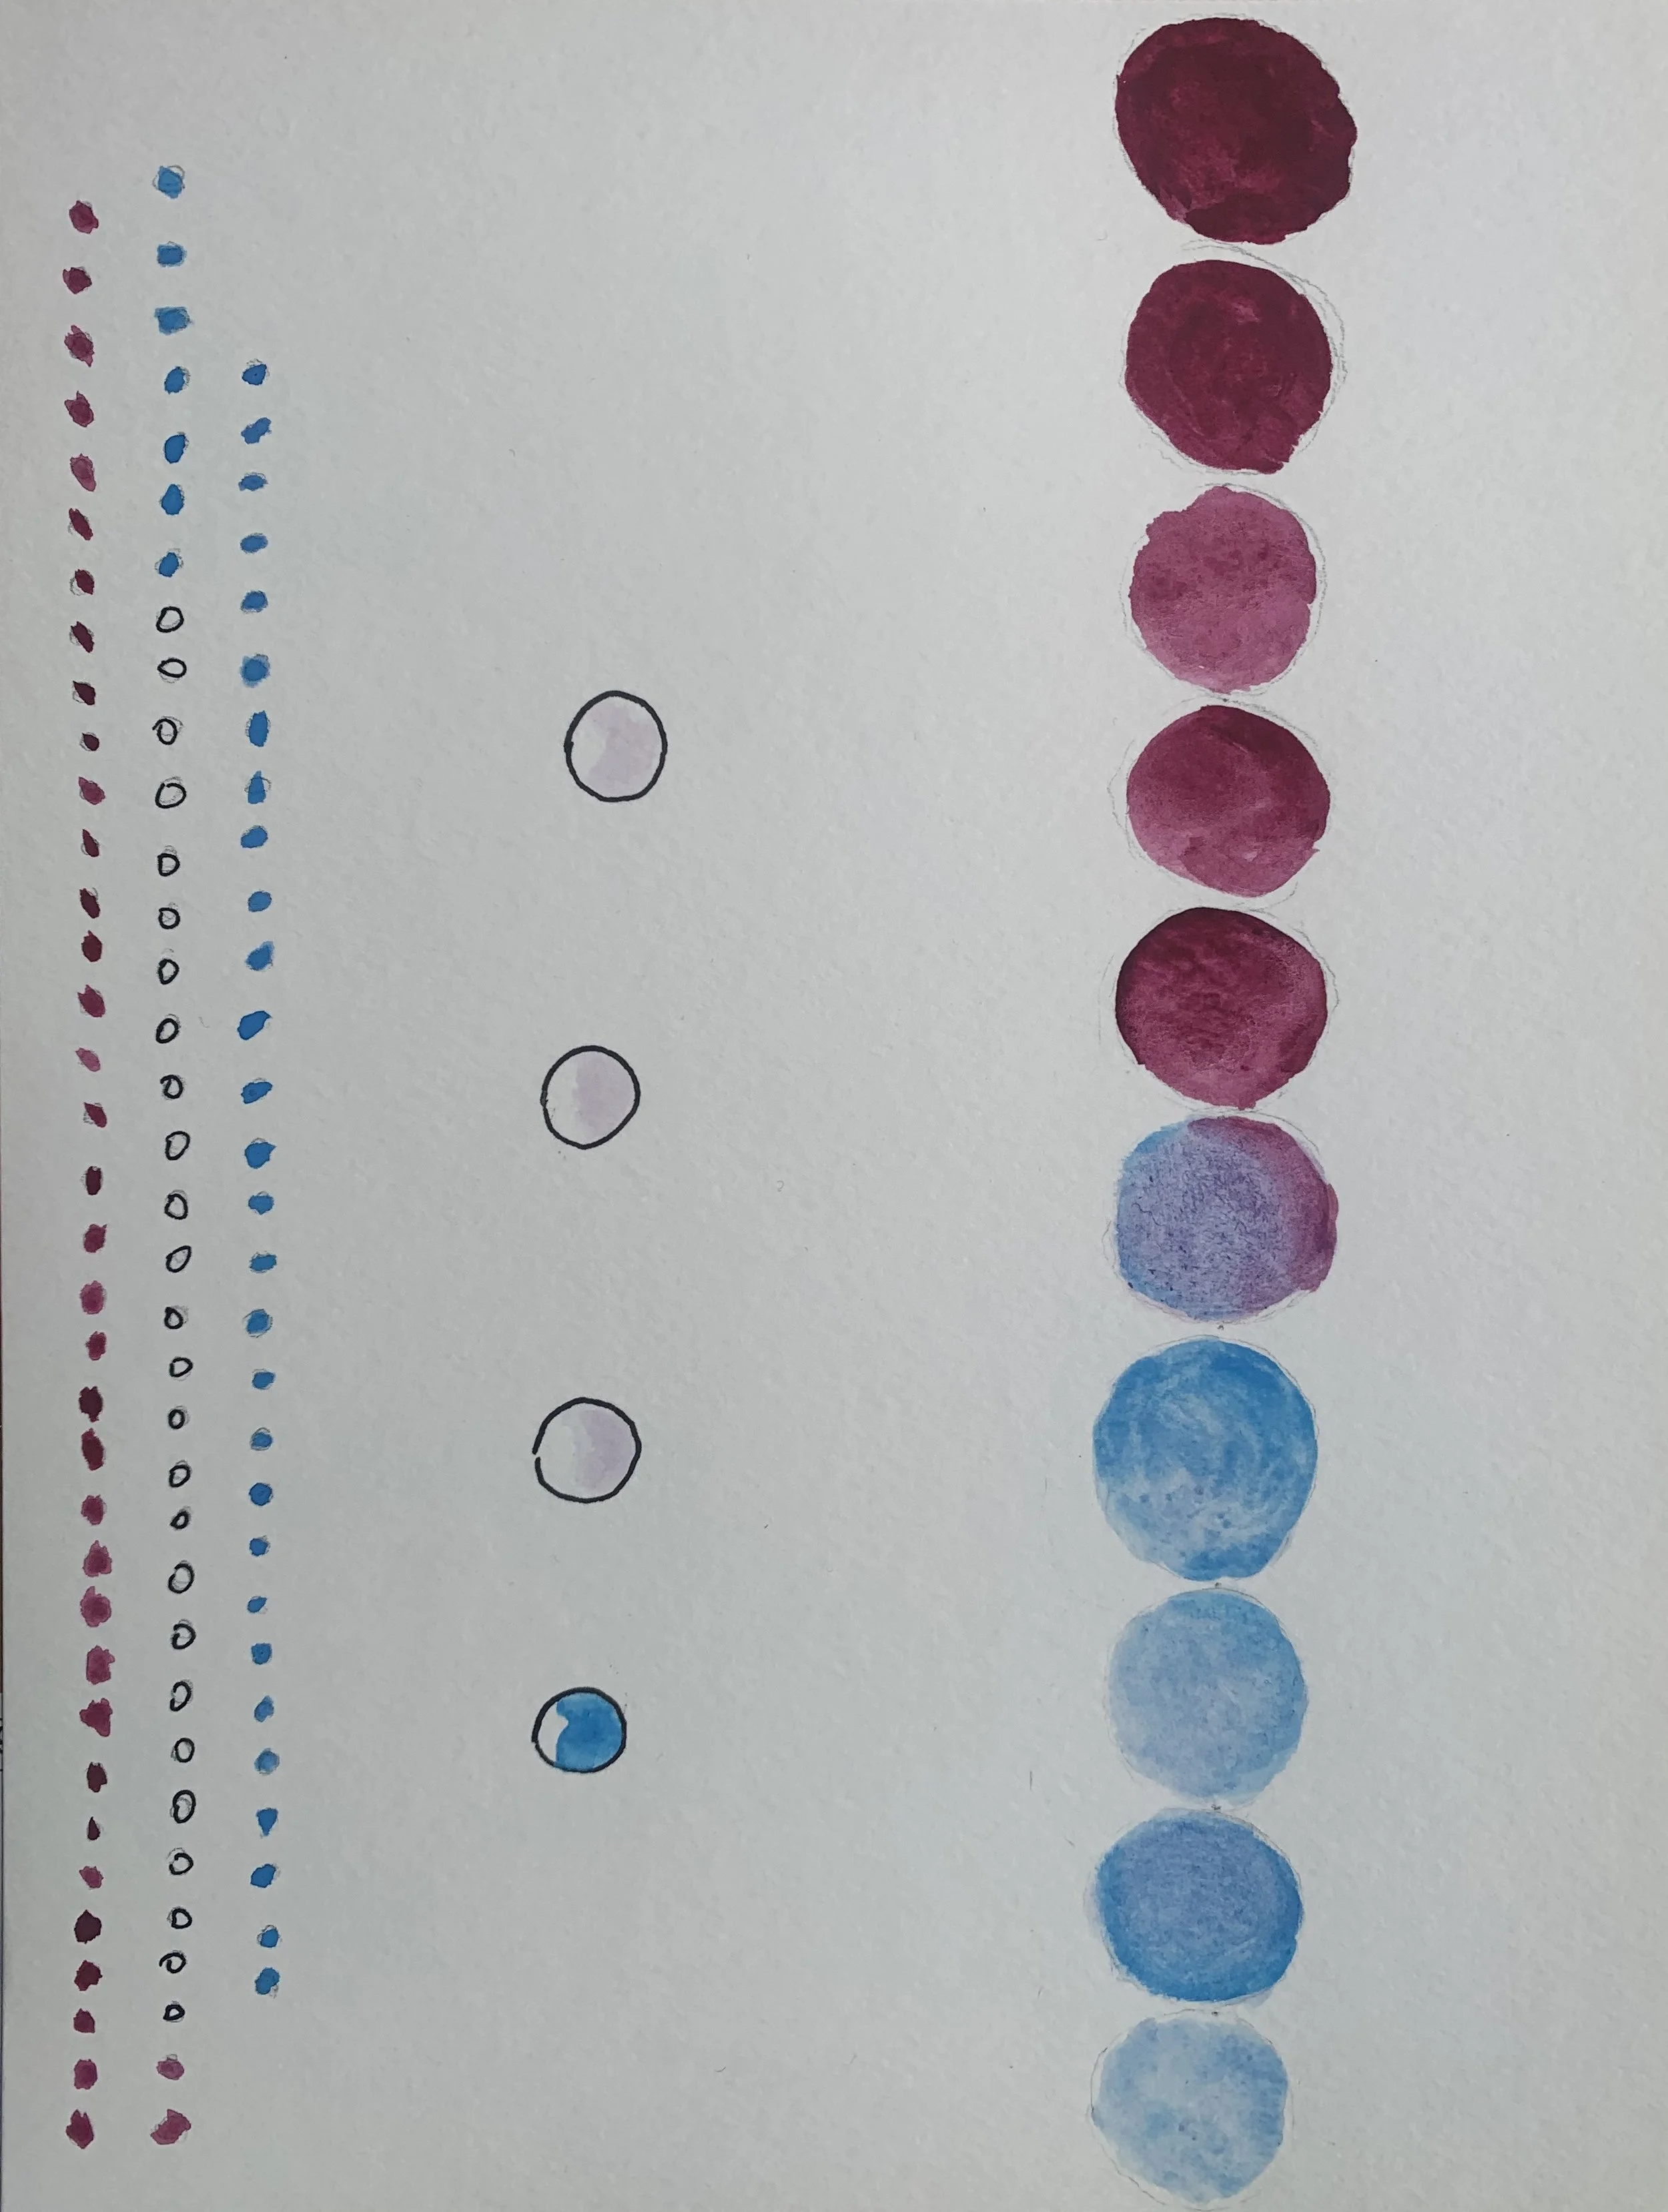
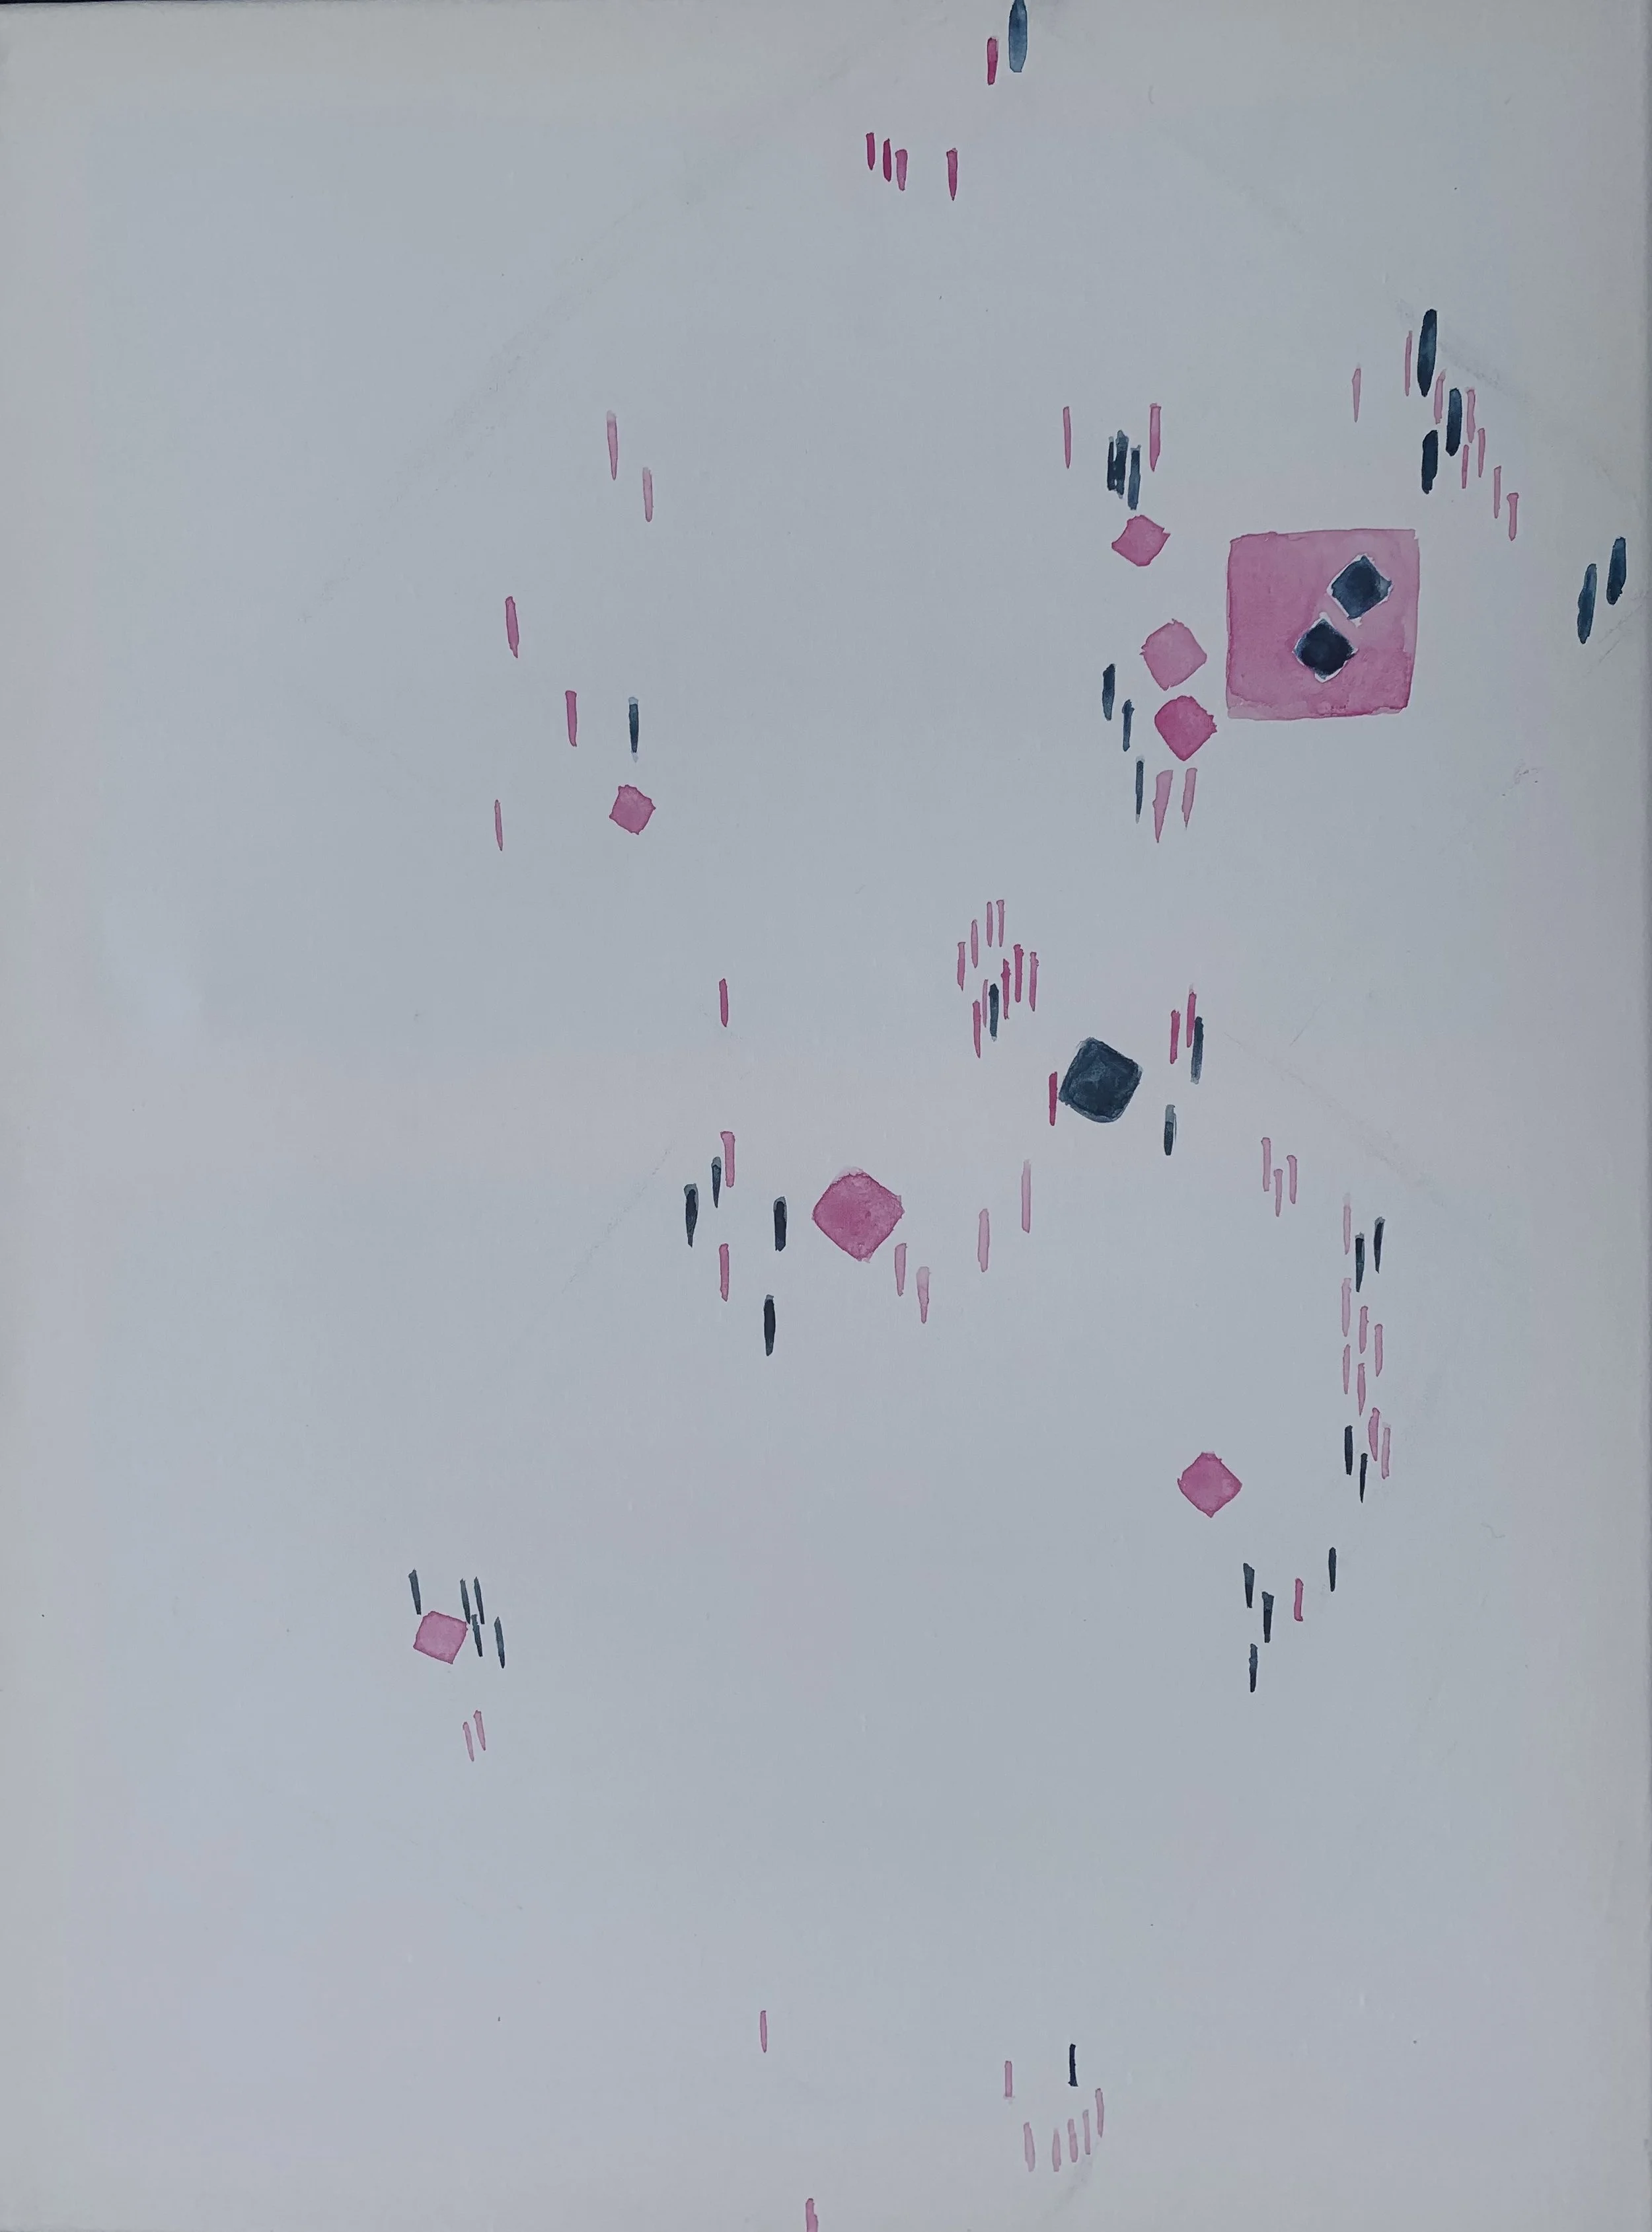
Lastly is the process for creating the data visualization book, which took a different turn compared to the other projects. I tend to work fast when I put down my water color so that I can make sure I get the right shades when working with it, so unfortunately there are no in progress shots for this piece. And since I was working with real data much of the initial process was finding information that would work and graphs I could potentially use. Information gathered came from JAMA network, Pew research, and GardenstateEquality (medical office location)
The Data recontextualized
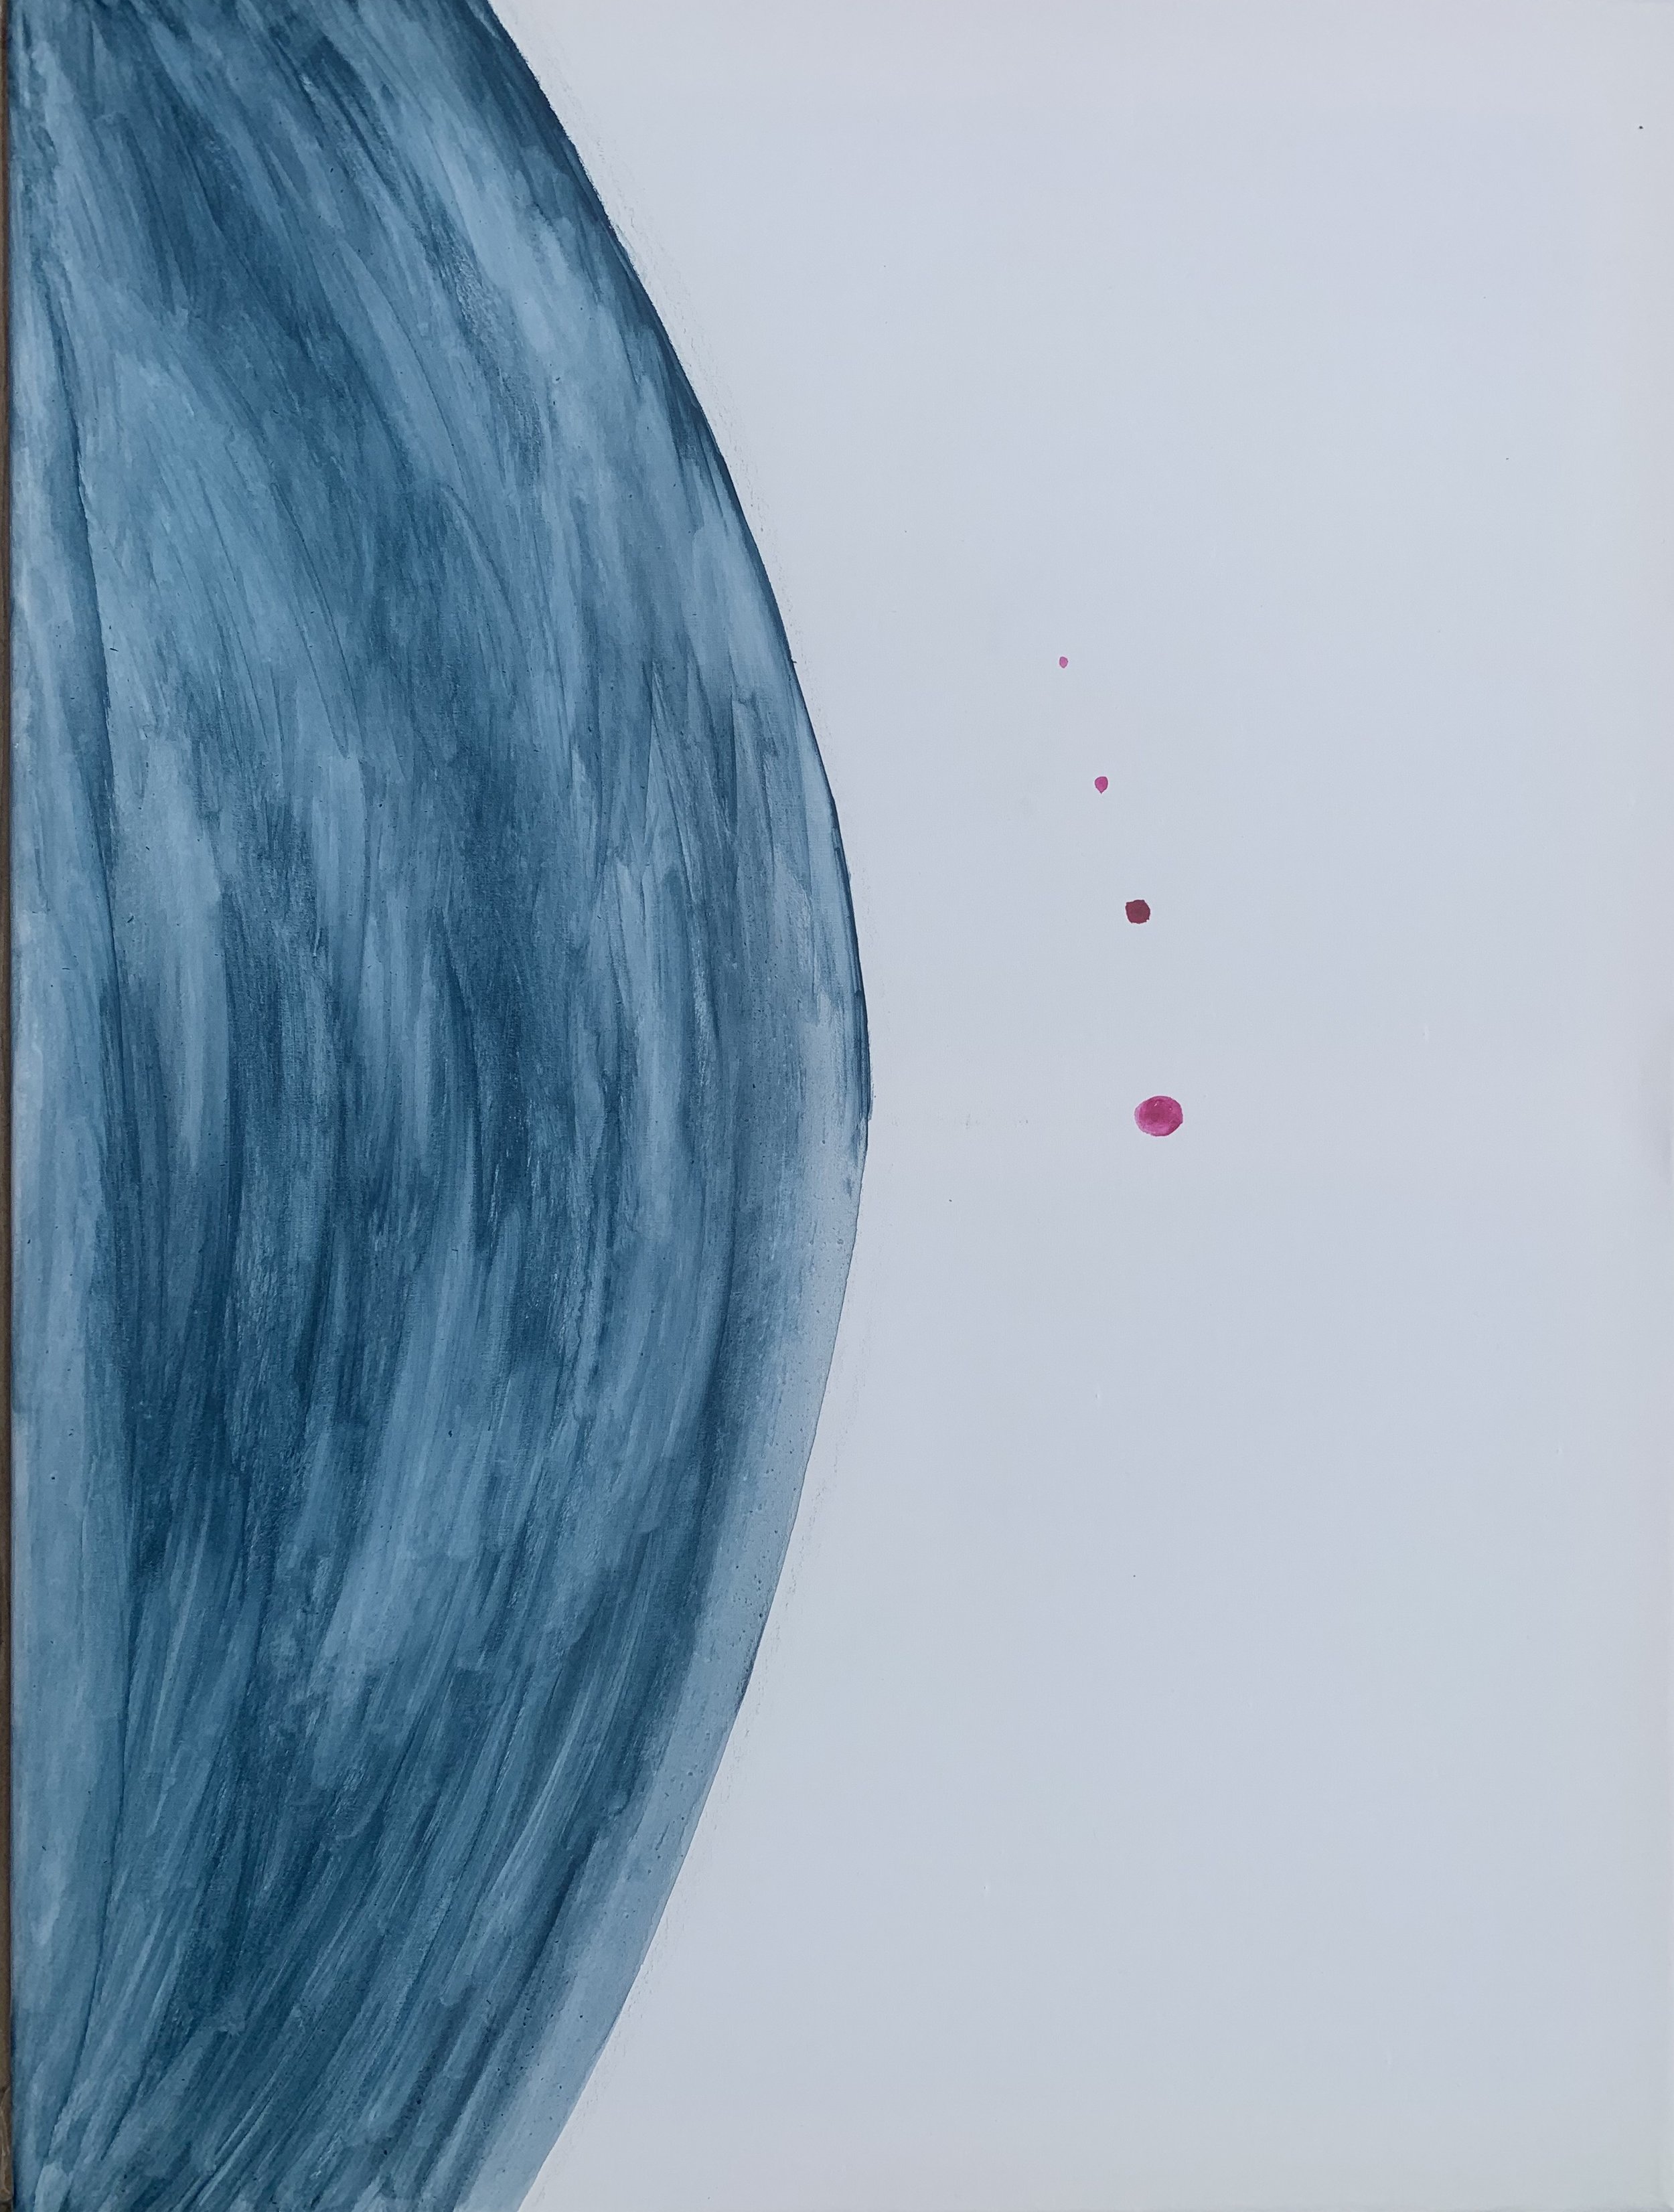
The next step was to recontextualize the data that I had gathered and turn it into watercolor pieces that would bring my projects together and make the date hopefully more interesting and digestible for the average viewer.
